
There’s been some concern about wait times and crowds increasing in recent weeks. Although we have seen some very busy days, midweek continues to be a sweet spot. Today’s wait times are a great example of a slower Wednesday at Walt Disney World. Let’s take a look at the numbers.
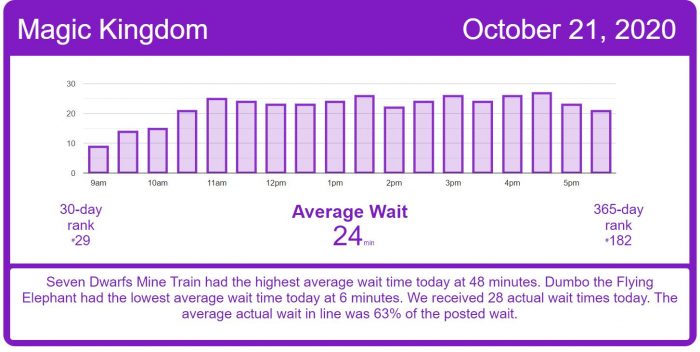
Magic Kingdom Wait Times
Let’s start with the wildest ride in the wilderness, Big Thunder Mountain Railroad which had an average wait time today of 39 minutes. Its 7-day average is 48 minutes, so today ranks #5 for this week. Its 30-day average is 45 minutes, so today ranks #22 for the past month. Its 365-day average is 52 minutes, so today ranks #160 for the past year.
Another mountain in the Magic Kingdom mountain range, Space Mountain had an average wait time today of 26 minutes. Its 7-day average is 49 minutes, so today ranks #6 for this week. Its 30-day average is 43 minutes, so today ranks #26 for the past month. Its 365-day average is 61 minutes, so today ranks #183 for the past year. We received 4 actual wait times today, and the actual wait averaged 43% of the posted wait time.
Peter Pan’s Flight had an average wait time today of 25 minutes. Its 7-day average is 38 minutes, so today ranks #6 for this week. Its 30-day average is 35 minutes, so today ranks #29 for the past month. Its 365-day average is 55 minutes, so today ranks #198 for the past year. Who can remember a day during any recent time before COVID-19 that Peter Pan’s Flight had a 25 minute wait? Certainly it is a rare occurrence.

It’s spooky season so a trip to socialize with some grim grinning ghosts sounds nice. The Haunted Mansion had an average wait time today of 33 minutes. Its 7-day average is 49 minutes, so today ranks #6 for this week. Its 30-day average is 45 minutes, so today ranks #28 for the past month. Its 365-day average is 45 minutes, so today ranks #176 for the past year. We received 4 actual wait times today, and the actual wait averaged 55% of the posted wait time. It’s a nice Halloween treat to have an actual wait time that’s 55% of Disney’s posted wait time.
It’s always fun to pay a visit to the Hundred Acre Wood. The Many Adventures of Winnie the Pooh had an average wait time today of 18 minutes. Its 7-day average is 26 minutes, so today ranks #6 for this week. Its 30-day average is 25 minutes, so today ranks #29 for the past month. Its 365-day average is 31 minutes, so today ranks #197 for the past year.
Today it took half the average 7-day wait time to make a splash at Under the Sea ~ Journey of the Little Mermaid, which had an average wait time today of 17 minutes. Its 7-day average is 30 minutes, so today ranks #6 for this week. Its 30-day average is 27 minutes, so today ranks #29 for the past month. Its 365-day average is 24 minutes, so today ranks #161 for the past year.
EPCOT Wait Times
Weekends have been quite busy at EPCOT, but weekdays are usually a breeze. The iconic Spaceship Earth had an average wait time today of 16 minutes. Its 7-day average is 22 minutes, so today ranks #4 for this week. Its 30-day average is 18 minutes, so today ranks #13 for the past month. Its 365-day average is 22 minutes, so today ranks #158 for the past year.
COVID-19 precautions have reduced the capacity at Soarin’ which had an average wait time today of 30 minutes. Its 30-day average is 35 minutes, so today ranks #15 for the past month. Its 365-day average is 40 minutes, so today ranks #164 for the past year.

It’s nice to know it’s pretty easy to visit our friend Figment. Journey Into Imagination With Figment had an average wait time today of 10 minutes. Its 7-day average is 20 minutes, so today ranks #6 for this week. Its 30-day average is 14 minutes, so today ranks #16 for the past month.
Sometimes Test Track can have a bumpy ride, but today it had an average wait time today of 49 minutes. Its 7-day average is 71 minutes, so today ranks #6 for this week. Its 30-day average is 61 minutes, so today ranks #20 for the past month.
And of course, the ride with the longest wait time, Frozen Ever After had an average wait time today of 57 minutes. Its 7-day average is 71 minutes, so today ranks #5 for this week. Its 30-day average is 62 minutes, so today ranks #17 for the past month.
Get actual wait times that are more accurate than Disney’s posted wait times, with our Walt Disney World touring plans. Subscribe today and get our Lines app.

Disney’s Hollywood Studios Wait Times
Everyone seems to be excited to head to Hollywood, as Disney’s Hollywood Studios often has the highest wait times of the four Walt Disney World. Today is no exception with the average wait here was 50 minutes versus 25 minutes at the other three parks. While the other parks had some of their lowest wait times today compared to other recent periods, Hollywood Studios had some of the highest wait times for the past seven days. In fact, every attraction at this park had their highest wait times today compared to the 7-day average, the only two exceptions being Millennium Falcon: Smugglers Run and Alien Swirling Saucers.
Theater based attractions have reduced capacity, leading to longer wait times, such as at Muppet*Vision 3D which had an average wait time today of 34 minutes. Its 7-day average is 15 minutes, so today ranks #1 for this week. We received 4 actual wait times today, and the actual wait averaged 84% of the posted wait time.
Another number one day was had at Rock ‘n’ Roller Coaster Starring Aerosmith had an average wait time today of 56 minutes. Its 7-day average is 55 minutes, so today ranks #3 for this week. Its 30-day average is 52 minutes, so today ranks #7 for the past month.
A great spooky attraction for this time of year, or otherwise, The Twilight Zone Tower of Terror had an average wait time today of 54 minutes. Its 7-day average is 53 minutes, so today ranks #1 for this week. Its 30-day average is 51 minutes, so today ranks #6 for the past month. Its 365-day average is 62 minutes, so today ranks #119 for the past year. We received 5 actual wait times today, and the actual wait averaged 62% of the posted wait time.
Slinky Dog Dash had an average wait time today of 76 minutes. Its 7-day average is 70 minutes, so today ranks #1 for this week. Its 30-day average is 67 minutes, so today ranks #2 for the past month. Its 365-day average is 76 minutes, so today ranks #116 for the past year. We received 5 actual wait times today, and the actual wait averaged 98% of the posted wait time.
And the busiest attraction is the newest, Mickey & Minnie’s Runaway Railway had an average wait time today of 91 minutes. Its 7-day average is 84 minutes, so today ranks #1 for this week. Its 30-day average is 84 minutes, so today ranks #2 for the past month. Its 365-day average is 70 minutes, so today ranks #12 for the past year.

Boarding groups at Rise of the Resistance started off well – and then around 10:30 a.m. there was a disturbance in the Force. It did not get back and running in the fight against the New Order until two hours later, around 12:30 p.m. This could have contributed to the higher wait times across the park, too.

Animal Kingdom Wait Times
If you’re looking for a nice and easy going park then Disney’s Animal Kingdom should be your pick. Most of the attractions there had fairly low wait times compared to the 7-day average. Though, Avatar Flight of Passage continues to soar with high wait times, today’s wait time of 69 minutes is relatively low. Its 7-day average is 87 minutes, so today ranks #6 for this week. Its 30-day average is 58 minutes, so today ranks #9 for the past month. We received 13 actual wait times today, and the actual wait averaged 66% of the posted wait time.
Just around the Pandora riverbend, Na’vi River Journey had an average wait time today of 39 minutes. Its 7-day average is 51 minutes, so today ranks #6 for this week. Its 30-day average is 44 minutes, so today ranks #22 for the past month. We received 7 actual wait times today, and the actual wait averaged 87% of the posted wait time.
It just wouldn’t be a visit to Animal Kingdom without a journey aboard Kilimanjaro Safaris which had an average wait time today of 18 minutes. Its 7-day average is 25 minutes, so today ranks #5 for this week. Its 365-day average is 52 minutes, so today ranks #179 for the past year. We received 8 actual wait times today, and the actual wait averaged 67% of the posted wait time.
Today was a good time to roar like a DINOSAUR which had an average wait time today of 23 minutes. Its 7-day average is 42 minutes, so today ranks #5 for this week. Its 30-day average is 30 minutes, so today ranks #18 for the past month. Its 365-day average is 33 minutes, so today ranks #165 for the past year. We received 12 actual wait times today, and the actual wait averaged 81% of the posted wait time.
As hard as we try to bring fall to Florida, the temperatures are still warm enough for a splash at Kali River Rapids which had an average wait time today of 11 minutes. Its 7-day average is 28 minutes, so today ranks #6 for this week. Its 30-day average is 24 minutes, so today ranks #28 for the past month. Its 365-day average is 24 minutes, so today ranks #136 for the past year.

The post Nice and Easy Day With Less Crowds – Walt Disney World Wait Times for Wednesday, October 21, 2020 appeared first on TouringPlans.com Blog.