

It was a relatively quiet day here in Walt Disney World, with only Animal Kingdom having above-average wait times. Perhaps everyone’s getting ready for next weekend; we expect Halloween at the Magic Kingdom to be one of the busiest days we’ve seen since re-opening. But that’s next week, and this is today. We received 143 actual wait times today across Walt Disney World, too. Let’s do the numbers.
Animal Kingdom Wait Times
DINOSAUR had an average wait time today of 51 minutes, which is the busiest it’s been for the past month. Congratulations and welcome to everyone at the Phylicia Rashad Fan Club who made this possible. Dinosaur’s 365-day average is 33 minutes, so today ranks #48 for the past year. We received 6 actual wait times today, and the actual wait averaged 70% of the posted wait time.
In Pandora, Avatar Flight of Passage had an average wait time today of 72 minutes, 2 minutes over its 7-day average (#3 for the week) and 10 over its 30-day average, so today ranks #7 for the past month. Its 365-day average is 103 minutes, so today ranks #150 for the past year. We received 7 actual wait times at FoP today, and the actual wait averaged 81% of the posted wait time.
Na’vi River Journey had an average wait time today of 56 minutes, #1 for the past week and #3 for the past month. We received 5 actual wait times today at Na’vi, and the actual wait averaged 99% of the posted wait time.

If you’ve got to visit during a busy weekend, have a special tool at your side. Subscribe today and get our Lines app too.
Expedition Everest had an average wait time today of 40 minutes. Its 7-day average is 33 minutes, so today ranks #2 for this week and #6 for the past month. We received 12 actual wait times today, and the actual wait averaged 71% of the posted wait time.
Kali River Rapids had an average wait time today of 34 minutes, #1 for the week and #6 for the month. We received 4 actual wait times today, and the actual wait averaged 97% of the posted wait time.
Kilimanjaro Safaris had an average wait time today of 26 minutes. The strange thing about Safaris today was that we received 9 actual wait times today, and the actual wait averaged 45% of the posted wait time.
Magic Kingdom Wait Times
Of the major attractions in the Magic Kingdom, Big Thunder Mountain Railroad had the longest relative waits today, but there’s a catch! Big Thunder’s average posted wait time today was 45 minutes, which is #2 for the week and #16 for the past month. But we received 6 actual wait times at BTMRR today, and the actual wait averaged 48% of the posted wait time.
Buzz Lightyear’s posted waits seem to have been inflated, too. Buzz Lightyear’s Space Ranger Spin had an average wait time today of 31 minutes (#3 week / #13 month). But the 7 actual wait times we got today at Buzz only averaged 46% of the posted wait time. So if the posted wait was 30, you really waited just under 15.
Wait times were more accurate over at Space Mountain. Space had an average wait time today of 44 minutes, #3 for the week and #17 for the past month. The 6 actual wait times we got at Space Mountain today averaged 92% of the posted wait time.
Pirates of the Caribbean had an average wait time today of 44 minutes (#3 week / #22 month / # 122 year). We received 6 actual wait times at Pirates today, and the actual wait averaged 75% of the posted wait time.
Seven Dwarfs Mine Train had an average wait time today of 54 minutes. Its 7-day average is 60 minutes, so today ranks #5 for this week. Its 30-day average is 61 minutes, so today ranks #22 for the past month. And Splash Mountain had an average wait time today of 61 minutes. Its 7-day average is 61 minutes, so today ranks #3 for this week. Its 30-day average is 64 minutes, so today ranks #17 for the past month
Throughout the park, actual wait times at the Magic Kingdom averaged 68% of the posted wait. So a posted wait of 30 minutes at The Barnstormer would’ve meant an actual wait of around 21 minutes.

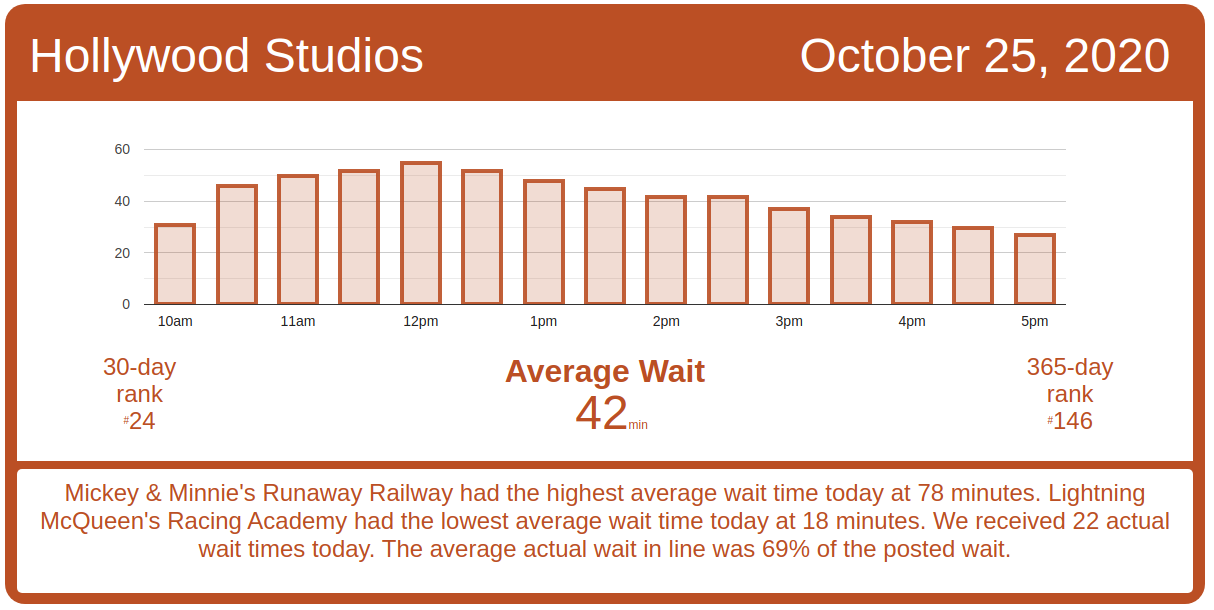
Hollywood Studios Wait Times
Mickey & Minnie’s Runaway Railway had an average wait time today of 78 minutes. Its 7-day average is 87 minutes, so today ranks #5 for this week. Its 30-day average is 83 minutes, so today ranks #24 for the past month. Toy Story Mania! had an average wait time today of 26 minutes, and the actual waits were not even that bad: 13 actual wait times today averaged 44% of the posted wait time, so your actual wait on TSM might’ve been under 15 minutes.
Rock ‘n’ Roller Coaster had an average wait time today of 54 minutes. Its 7-day average is 53 minutes, so today ranks #3 for this week. Its 30-day average is 52 minutes, so today ranks #10 for the past month. And things were calmer over at The Twilight Zone Tower of Terror, which had an average wait today of 43 minutes. Its 7-day average is 56 minutes, so today ranks #6 for this week. Its 30-day average is 51 minutes, so today ranks #25 for the past month.
Actual wait times at Hollywood Studios were around 69% of the posted wait, so a posted wait of 70 minutes at Slinky Dog Dash meant an actual wait of around 49 minutes.
Rise of the Resistance boarding groups ran a little slower than average for the past week from about 11 a.m. on. It looks like there was a ride slowdown or stoppage just around 11 a.m. today for a little more than half an hour, and then perhaps two more – for twenty minutes around 3:30 p.m. and again at 4:00 p.m.

EPCOT Wait Times
Frozen Ever After had an average wait time today of 66 minutes. Its 7-day average is 63 minutes, so today ranks #2 for this week. Its 30-day average is 64 minutes, so today ranks #13 for the past month.
Soarin’ had an average wait time today of 42 minutes. Its 7-day average is 34 minutes, so today ranks #1 for this week. Its 30-day average is 38 minutes, so today ranks #12 for the past month.
Spaceship Earth had an average wait time today of 25 minutes. Its 7-day average is 17 minutes, so today ranks #1 for this week. Its 30-day average is 19 minutes, so today ranks #9 for the past month. We received 5 actual wait times today at SSE, and the actual wait averaged 58% of the posted wait time.
Test Track had an average wait time today of 69 minutes. Its 7-day average is 64 minutes, so today ranks #1 for this week. Its 30-day average is 64 minutes, so today ranks #8 for the past month. Its 365-day average is 58 minutes – today ranks #52 for the past year.

The post Animal Kingdom Busiest, Hollywood Studios Least Busy – Walt Disney World Wait Times for Sunday, October 25, 2020 appeared first on TouringPlans.com Blog.