

Every day is a good day to be in a Disney theme park. When it comes to low posted wait times, today was one of the best days of the past month, with relatively low crowds in all four Disney theme parks. We’re going to do the numbers next.
Also, we’ve started a new research project to quantify how well guests are following Disney’s park rules for masks. To do this, we’ll be counting a few hundred people each day to see how many are completely following those rules. We counted 500 people yesterday at Animal Kingdom, and 96% (480 out of 500) were fully complying with all of Disney’s guidelines. Of those 20 that were not, most were eating or drinking while walking, where Disney’s rules say to be stationary. We’re counting at EPCOT tonight and will post those numbers tomorrow.
Hollywood Studios Wait Times
I usually start these posts with Runaway Railway, because it’s my favorite attraction in the park (that I can get on reliably, anyway–looking at you Rise of the Resistance). Mickey & Minnie’s Runaway Railway had an average wait time today of 65 minutes, 16 below its 7-day average of 81 minutes, therefore today ranks #6 for this week. Its 30-day average is 83 minutes, so today ranks #29 for the past month.

Same thing over in Galaxy’s Edge: Millennium Falcon: Smugglers Run had an average wait time today of 44 minutes, 15 below its 7-day average and #6 for the week (#28 for the month).
Here were the waits in Toy Story Land:
- Toy Story Mania had an average wait time today of 25 minutes – that’s #5 for the week and #26 for the month.
- Slinky Dog Dash had an average wait time today of 50 minutes – #6 for the week and #28 for the month.
- Alien Swirling Saucers had an average wait time today of 16 minutes – #5 for the week and #27 for the month.
And amid the glitz and glamour of 1940’s Hollywood, here’s what it was like on Sunset Boulevard:
- Rock ‘n’ Roller Coaster Starring Aerosmith had an average wait time today of 38 minutes – #6 for the week and #28 for the month.
- The Twilight Zone Tower of Terror had an average wait time today of 35 minutes also #6 and #28.
As you can see, weekdays are the way to go. If you’ve got to visit during a busy weekend, have a special tool at your side. Subscribe today and get our Lines app too.
Rise of the Resistance boarding groups started well. Then like a Zoom call full of Ewoks (I was going to say tribbles just for the comments), everything went wrong. In this case, it looks like boarding stopped for about an hour, from 11:15 a.m. to 12:15 p.m., and again for about half an hour just before 4 p.m.

Animal Kingdom Wait Times
Avatar Flight of Passage had an average wait time today of 30 minutes, just over half of its 7-day average of 57 minutes (#5 week), and just under half of its 30-day average of 62 minutes (#26 month). We received 9 actual wait times today, and the actual wait averaged 82% of the posted wait time, so your actual wait at Flight of Passage probably averaged around 25 minutes.
Likewise, Na’vi River Journey’s average wait time today was 36 minutes, #5 for the week and #26 for the month.
In Asia, Expedition Everest had an average posted wait today of 19 minutes. That’s #5 for the week and #23 for the month. But even that relatively low posted wait might be inflated: We received 6 actual wait times today, and the actual wait averaged 33% of the posted wait time. Kali River Rapids had an average wait time today of 12 minutes (#6 week / #28 month).
Finally, in Dinoland U.S.A., DINOSAUR had an average wait time today of 20 minutes. Its 7-day average is 29 minutes, so today ranks #4 for this week. Its 30-day average is 31 minutes, so today ranks #21 for the past month. We received 5 actual wait times today, and the actual wait averaged 67% of the posted wait time.

Magic Kingdom Wait Times
Let’s start in Frontierland, where Big Thunder Mountain Railroad had an average wait time today of 32 minutes, 15 below its 7-day average and 13 below its 30-day average. That makes today #6 for the week and #28 for the past month. Splash Mountain had an average wait time today of 31 minutes, with 7- and 30-day rankings similar to BTMRR (#6 / #29).
The Haunted Mansion had an average wait time today of 30 minutes. Its 7-day average is 45 minutes, so today ranks #5 for this week. Its 30-day average is 44 minutes, so today ranks #28 for the past month. We received 4 actual wait times today, and the actual wait averaged 45% of the posted wait time.
Here’s a look at Fantasyland’s top attractions’ wait times today:
- Seven Dwarfs Mine Train had an average wait time today of 40 minutes. Its 7-day average is 56 minutes, so today ranks #6 for this week. Its 30-day average is 60 minutes, so today ranks #29 for the past month
- Peter Pan’s Flight had an average wait time today of 21 minutes. Its 7-day average is 33 minutes, so today ranks #6 for this week. Its 30-day average is 34 minutes, so today ranks #29 for the past month. We received 5 actual wait times today for Pan, and the actual wait averaged 54% of the posted wait.
- Dumbo the Flying Elephant had an average wait time today of 7 minutes. Its 7-day average is 11 minutes, so today ranks #5 for this week. Its 30-day average is 12 minutes, so today ranks #27 for the past month.
- “it’s a small world” had an average wait time today of 24 minutes. Its 7-day average is 37 minutes, so today ranks #6 for this week. Its 30-day average is 36 minutes, so today ranks #29 for the past month.
And in Tomorrowland, Space Mountain had an average wait time today of 14 minutes – good day to go on Space. Its 7-day average is 38 minutes, so today ranks #6 for this week. Its 30-day average is 42 minutes, so today ranks #29 for the past month. We received 6 actual wait times today, and the actual wait averaged 33% of the posted wait time. Finally, Buzz Lightyear’s posted wait time averaged 13 minutes. Its 7-day average is 31 minutes, so today ranks #6 for this week. Its 30-day average is 31 minutes, so today ranks #29 for the past month.

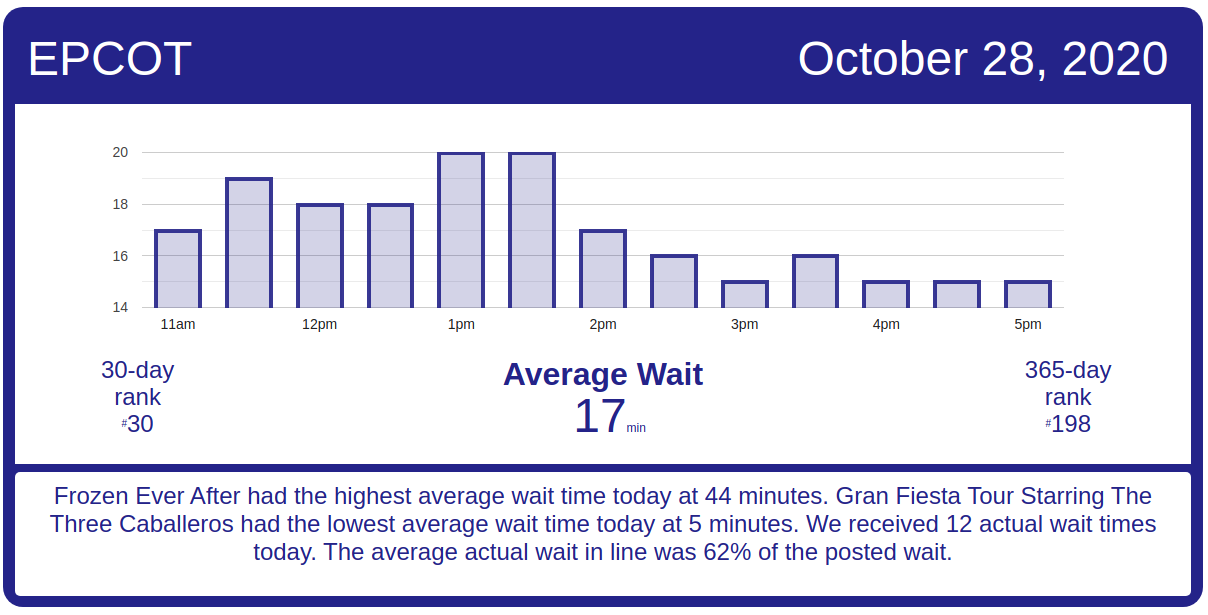
EPCOT Wait Times
Starting with the park’s iconic ride, Spaceship Earth had an average wait time today of 11 minutes. Its 7-day average is 18 minutes, so today ranks #4 for this week. Its 30-day average is 18 minutes, so today ranks #24 for the past month. No less symbolic, Soarin’ had an average wait time today of 22 minutes. Its 7-day average is 34 minutes, so today ranks #5 for this week. Its 30-day average is 36 minutes, so today ranks #23 for the past month.
The archetypal EPCOT ride Living with the Land had an average wait time today of 12 minutes. Its 7-day average is 13 minutes, so today ranks #3 for this week. Its 30-day average is 13 minutes, so today ranks #18 for the past month. And on the other side of the park, EPCOT’s prototypical Mission: SPACE Orange had an average wait time today of 13 minutes. Its 7-day average is 25 minutes, so today ranks #6 for this week. Its 30-day average is 26 minutes, so today ranks #28 for the past month.
Over in World Showcase, EPCOT’s paradigmatic Frozen Ever After had an average wait time of 44 minutes today. Its 7-day average is 61 minutes, so today ranks #5 for this week. Its 30-day average is 63 minutes, so today ranks #28 for the past month.
The post Low Midweek Crowds Everywhere – Walt Disney World Wait Times for Wednesday, October 28, 2020 appeared first on TouringPlans.com Blog.