

Posted wait times were moderate across Walt Disney World today, and at some attractions the actual wait time was significantly lower than that. We received 183 actual wait times today – thanks to everyone who uses our Lines app. Let’s do the numbers!
Magic Kingdom Wait Times
Today’s Magic Kingdom coverage will focus entirely on the theme “rides with water.” “it’s a small world” had an average wait time today of 33 minutes. Its 7-day average is 39 minutes, so today ranks #5 for this week. Its 30-day average is 36 minutes, so today ranks #17 for the past month.
Jungle Cruise had an average wait time today of 41 minutes. Its 7-day average is 44 minutes, so today ranks #4 for this week. Its 30-day average is 41 minutes, so today ranks #16 for the past month. We received 5 actual wait times today, and the actual wait averaged 95% of the posted wait time.
Splash Mountain had an average wait time today of 42 minutes. Its 7-day average is 57 minutes, so today ranks #4 for this week. Its 30-day average is 52 minutes, so today ranks #20 for the past month.
Pirates of the Caribbean had an average wait time today of 39 minutes. Its 7-day average is 44 minutes, so today ranks #5 for this week. Its 30-day average is 42 minutes, so today ranks #19 for the past month. We received 4 actual wait times today, and the actual wait averaged 73% of the posted wait time.
The Magic Carpets of Aladdin (has a camel that spits water) had an average wait time today of 11 minutes. Its 7-day average is 12 minutes, so today ranks #5 for this week. Its 30-day average is 12 minutes, so today ranks #22 for the past month.
Under the Sea ~ Journey of the Little Mermaid had an average wait time today of 18 minutes. Its 7-day average is 20 minutes, so today ranks #4 for this week. Its 30-day average is 22 minutes, so today ranks #20 for the past month. We received 7 actual wait times today, and the actual wait averaged 40% of the posted wait time.
The Many Adventures of Winnie the Pooh (has a rain scene) had an average wait time today of 23 minutes. Its 7-day average is 24 minutes, so today ranks #4 for this week. Its 30-day average is 23 minutes, so today ranks #15 for the past month.
Peter Pan’s Flight (has multiple water-based scenes) had an average wait time today of 32 minutes. Its 7-day average is 33 minutes, so today ranks #3 for this week. Its 30-day average is 31 minutes, so today ranks #13 for the past month. We received 4 actual wait times today, and the actual wait averaged 66% of the posted wait time.
Mickey’s PhilharMagic (has water effects) had an average wait time today of 25 minutes. Its 7-day average is 19 minutes, so today ranks #1 for this week. Its 30-day average is 18 minutes, so today ranks #1 for the past month.
Big Thunder Mountain Railroad (has multiple water features) had an average wait time today of 42 minutes. Its 7-day average is 47 minutes, so today ranks #5 for this week. Its 30-day average is 43 minutes, so today ranks #16 for the past month. We received 6 actual wait times today, and the actual wait averaged 34% of the posted wait time (wow!).
Dumbo the Flying Elephant (ride base is water feature) had an average wait time today of 11 minutes. Its 7-day average is 14 minutes, so today ranks #4 for this week. Its 30-day average is 11 minutes, so today ranks #13 for the past month.
Mad Tea Party (tea requires water) had an average wait time today of 11 minutes. Its 7-day average is 13 minutes, so today ranks #6 for this week. Its 30-day average is 12 minutes, so today ranks #17 for the past month.
Seven Dwarfs Mine Train (has outdoor waterfall) had an average wait time today of 63 minutes. Its 7-day average is 61 minutes, so today ranks #3 for this week. Its 30-day average is 56 minutes, so today ranks #7 for the past month. We received 6 actual wait times today, and the actual wait averaged 49% of the posted wait time.

If you’re planning on visiting Walt Disney World this holiday season, you’ll need a special tool at your side. Subscribe today and get our Lines app too.

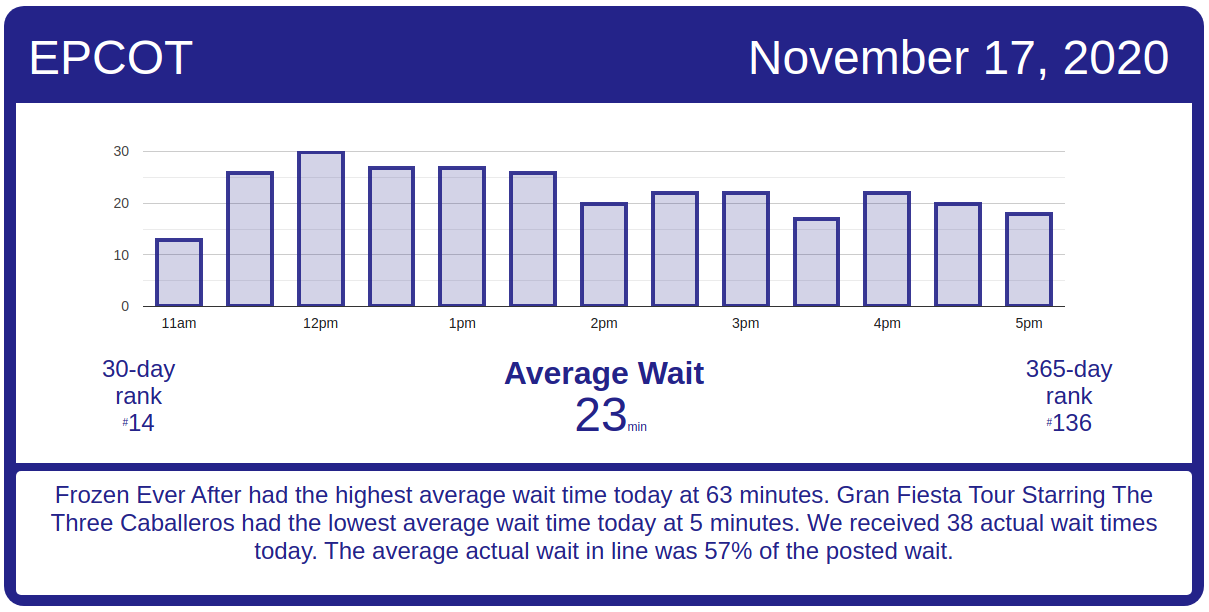
EPCOT Wait Times
Journey Into Imagination With Figment had an average wait time today of 14 minutes. Its 7-day average is 16 minutes, so today ranks #3 for this week. Its 30-day average is 15 minutes, so today ranks #12 for the past month. We received 6 actual wait times today (y’all are the best!), and the actual wait averaged 73% of the posted wait time.
Living with the Land had an average wait time today of 10 minutes. Its 7-day average is 12 minutes, so today ranks #5 for this week. Its 30-day average is 13 minutes, so today ranks #25 for the past month.
Mission: SPACE Orange had an average wait time today of 18 minutes. Its 7-day average is 26 minutes, so today ranks #3 for this week. Its 30-day average is 23 minutes, so today ranks #17 for the past month. Mission: SPACE Green had an average wait time today of 5 minutes.
Soarin’ had an average wait time today of 34 minutes. Its 7-day average is 39 minutes, so today ranks #3 for this week. Its 30-day average is 33 minutes, so today ranks #11 for the past month.We received 7 actual wait times today, and the actual wait averaged 102% of the posted wait time (also wow!).
Spaceship Earth had an average wait time today of 12 minutes. Its 7-day average is 22 minutes, so today ranks #6 for this week. Its 30-day average is 18 minutes, so today ranks #24 for the past month.
Test Track had an average wait time today of 45 minutes. Its 7-day average is 57 minutes, so today ranks #6 for this week. Its 30-day average is 57 minutes, so today ranks #26 for the past month. We received 8 actual wait times today, and the actual wait averaged 49% of the posted wait time.
The Seas with Nemo & Friends had an average wait time today of 7 minutes. Its 7-day average is 12 minutes, so today ranks #6 for this week. Its 30-day average is 11 minutes, so today ranks #29 for the past month. We received 4 actual wait times today, and the actual wait averaged 70% of the posted wait time.
Frozen Ever After had an average wait time today of 63 minutes. Its 7-day average is 69 minutes, so today ranks #4 for this week. Its 30-day average is 63 minutes, so today ranks #12 for the past month. We received 5 actual wait times today, and the actual wait averaged 53% of the posted wait time.
Hollywood Studios Wait Times
Rock ‘n’ Roller Coaster Starring Hanson (just checking to see who’s read this far!) had an average wait time today of 47 minutes. Its 7-day average is 51 minutes, so today ranks #4 for this week. Its 30-day average is 50 minutes, so today ranks #21 for the past month. Its 365-day average is 63 minutes, so today ranks #164 for the past year.
Star Tours: The Adventures Continue had an average wait time today of 26 minutes. Its 7-day average is 26 minutes, so today ranks #2 for this week. Its 30-day average is 27 minutes, so today ranks #16 for the past month. Its 365-day average is 27 minutes, so today ranks #114 for the past year.
The Twilight Zone Tower of Terror had an average wait time today of 44 minutes. Its 7-day average is 50 minutes, so today ranks #4 for this week. Its 30-day average is 49 minutes, so today ranks #21 for the past month. We received 4 actual wait times today, and the actual wait averaged 67% of the posted wait time.
Toy Story Mania! had an average wait time today of 25 minutes. Its 7-day average is 29 minutes, so today ranks #5 for this week. Its 30-day average is 28 minutes, so today ranks #21 for the past month. We received 10 actual wait times today, and the actual wait averaged 40% of the posted wait time.
Slinky Dog Dash had an average wait time today of 70 minutes. Its 7-day average is 66 minutes, so today ranks #1 for this week. Its 30-day average is 66 minutes, so today ranks #5 for the past month.
Mickey & Minnie’s Runaway Railway had an average wait time today of 52 minutes. Its 7-day average is 80 minutes, so today ranks #6 for this week. Its 30-day average is 79 minutes, so today ranks #29 for the past month. We received 7 actual wait times today, and the actual wait averaged 57% of the posted wait time.

Millennium Falcon: Smugglers Run had an average wait time today of 53 minutes. Its 7-day average is 51 minutes, so today ranks #3 for this week. Its 30-day average is 56 minutes, so today ranks #18 for the past month. We received 6 actual wait times today, and the actual wait averaged 88% of the posted wait time.
Rise of the Resistance ran pretty well today, except for one delay of almost an hour in calling boarding groups from noon to 1 p.m.

Animal Kingdom Wait Times
DINOSAUR had an average wait time today of 14 minutes. Its 7-day average is 35 minutes, so today ranks #5 for this week. Its 30-day average is 29 minutes, so today ranks #27 for the past month. We received 4 actual wait times today, and the actual wait averaged 85% of the posted wait time.
Expedition Everest had an average wait time today of 29 minutes. Its 7-day average is 34 minutes, so today ranks #4 for this week. Its 30-day average is 31 minutes, so today ranks #15 for the past month. We received 12 actual wait times today, and the actual wait averaged 60% of the posted wait time.
Kali River Rapids had an average wait time today of 11 minutes. Its 7-day average is 22 minutes, so today ranks #6 for this week. Its 30-day average is 20 minutes, so today ranks #28 for the past month.
Kilimanjaro Safaris had an average wait time today of 16 minutes. Its 7-day average is 28 minutes, so today ranks #5 for this week. Its 30-day average is 22 minutes, so today ranks #22 for the past month. We received 6 actual wait times today, and the actual wait averaged 41% of the posted wait time.
Na’vi River Journey had an average wait time today of 48 minutes. Its 7-day average is 54 minutes, so today ranks #4 for this week. Its 30-day average is 47 minutes, so today ranks #9 for the past month. Its 365-day average is 59 minutes, so today ranks #135 for the past year. We received 7 actual wait times today, and the actual wait averaged 66% of the posted wait time.
Avatar Flight of Passage had an average wait time today of 53 minutes. Its 7-day average is 60 minutes, so today ranks #5 for this week. Its 30-day average is 56 minutes, so today ranks #16 for the past month. We received 11 actual wait times today, and the actual wait averaged 71% of the posted wait time – that’s pretty consistent.

The post Average Crowds All Around – Disney World Wait Times for Tuesday, November 17, 2020 appeared first on TouringPlans.com Blog.