

EPCOT and Disney’s Animal Kingdom had some of their largest wait times of the past month on Sunday, while Magic Kingdom was average, and crowds were low at Hollywood Studios. We received more than 120 actual wait times in Walt Disney World today. Let’s do the numbers!
Magic Kingdom Wait Times
Big Thunder Mountain Railroad had an average wait time today of 45 minutes. Its 7-day average is 45 minutes, so today ranks #3 for this week. Its 30-day average is 44 minutes, so today ranks #13 for the past month. We received 10 actual wait times today at BTMRR, and the actual wait averaged 42% of the posted wait time.
Buzz Lightyear’s Space Ranger Spin had an average wait time today of 30 minutes. Its 7-day average is 26 minutes, so today ranks #2 for this week. Its 30-day average is 30 minutes, so today ranks #13 for the past month. We received 6 actual wait times today, and the actual wait averaged 63% of the posted wait time.
Seven Dwarfs Mine Train had an average wait time today of 60 minutes. Its 7-day average is 55 minutes, so today ranks #3 for this week. Its 30-day average is 59 minutes, so today ranks #14 for the past month. We received 4 actual wait times today, and the actual wait averaged 85% of the posted wait time.
The Many Adventures of Winnie the Pooh had an average wait time today of 24 minutes. Its 7-day average is 22 minutes, so today ranks #2 for this week. Its 30-day average is 24 minutes, so today ranks #14 for the past month.
The Haunted Mansion had an average wait time today of 30 minutes. Its 7-day average is 36 minutes, so today ranks #4 for this week. Its 30-day average is 43 minutes, so today ranks #25 for the past month. Its 365-day average is 45 minutes, so today ranks #181 for the past year. We received 6 actual wait times today, and the actual wait averaged 51% of the posted wait time.

Peter Pan’s Flight had an average wait time today of 36 minutes. Its 7-day average is 31 minutes, so today ranks #2 for this week. Its 30-day average is 34 minutes, so today ranks #12 for the past month.
Pirates of the Caribbean had an average wait time today of 46 minutes. Its 7-day average is 41 minutes, so today ranks #2 for this week. Its 30-day average is 45 minutes, so today ranks #13 for the past month.
Space Mountain had an average wait time today of 39 minutes. Its 7-day average is 33 minutes, so today ranks #3 for this week. Its 30-day average is 40 minutes, so today ranks #18 for the past month. We received 4 actual wait times today, and the actual wait averaged 56% of the posted wait time.
Jungle Cruise had an average wait time today of 50 minutes. Its 7-day average is 42 minutes, so today ranks #2 for this week. Its 30-day average is 41 minutes, so today ranks #3 for the past month. We received 4 actual wait times today, and the actual wait averaged 73% of the posted wait time.
Splash Mountain had an average wait time today of 48 minutes. Its 7-day average is 50 minutes, so today ranks #2 for this week. Its 30-day average is 59 minutes, so today ranks #21 for the past month. We received 9 actual wait times today, and the actual wait averaged 56% of the posted wait time.
If you’re planning on visiting Walt Disney World this holiday season, you’ll need a special tool at your side. Subscribe today and get our Lines app too.

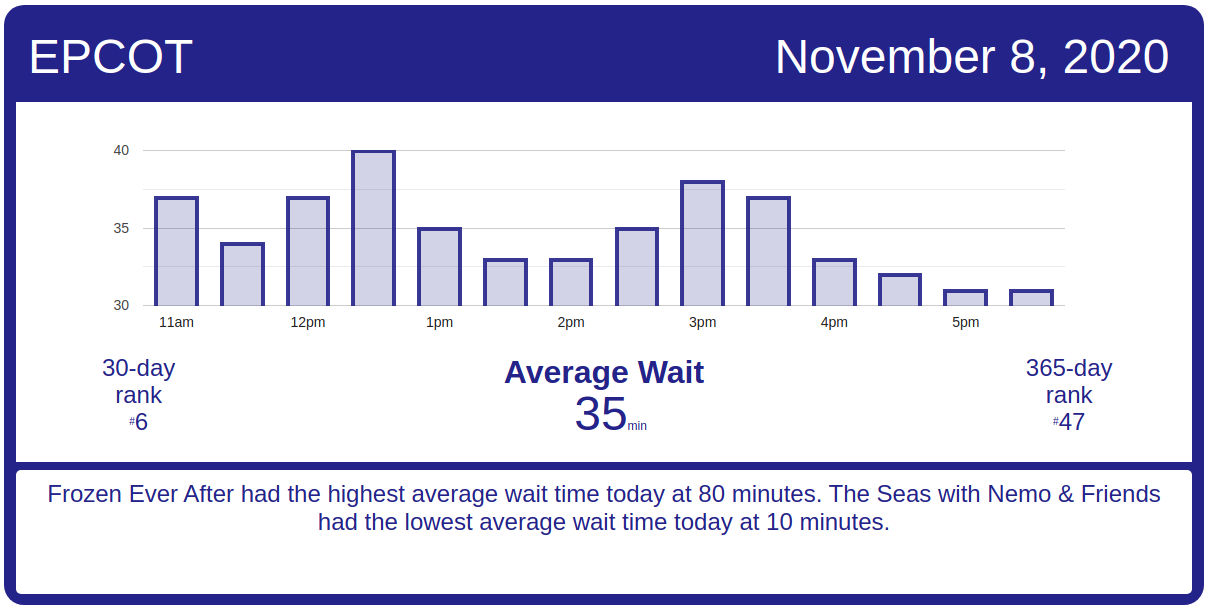
EPCOT Wait Times
Soarin‘ had an average wait time today of 45 minutes. Its 7-day average is 32 minutes, so today ranks #1 for this week. Its 30-day average is 37 minutes, so today ranks #8 for the past month.
Spaceship Earth had an average wait time today of 25 minutes. Its 7-day average is 16 minutes, so today ranks #1 for this week. Its 30-day average is 19 minutes, so today ranks #8 for the past month.
The Seas with Nemo & Friends had an average wait time today of 10 minutes. Its 7-day average is 11 minutes, so today ranks #3 for this week. Its 30-day average is 13 minutes, so today ranks #17 for the past month.
Frozen Ever After had an average wait time today of 80 minutes. Its 7-day average is 84 minutes, so today ranks #1 for this week. Its 30-day average is 66 minutes, so today ranks #4 for the past month.
Test Track had an average wait time today of 67 minutes. Its 7-day average is 53 minutes, so today ranks #1 for this week. Its 30-day average is 62 minutes, so today ranks #10 for the past month.
Living with the Land had an average wait time today of 17 minutes. Its 7-day average is 12 minutes, so today ranks #1 for this week. Its 30-day average is 13 minutes, so today ranks #3 for the past month.
Hollywood Studios Wait Times
Mickey & Minnie’s Runaway Railway had an average wait time today of 72 minutes. Its 7-day average is 81 minutes, so today ranks #6 for this week. Its 30-day average is 80 minutes, so today ranks #24 for the past month.
Rock ‘n’ Roller Coaster Starring Aerosmith had an average wait time today of 57 minutes. Its 7-day average is 51 minutes, so today ranks #1 for this week. Its 30-day average is 52 minutes, so today ranks #4 for the past month.
Star Tours: The Adventures Continue had an average wait time today of 23 minutes. Its 7-day average is 27 minutes, so today ranks #6 for this week. Its 30-day average is 29 minutes, so today ranks #26 for the past month.
The Tower of Terror had an average wait time today of 47 minutes. Its 7-day average is 52 minutes, so today ranks #6 for this week. Its 30-day average is 49 minutes, so today ranks #17 for the past month. We received 6 actual wait times today, and the actual wait averaged 69% of the posted wait time.
Toy Story Mania! had an average wait time today of 26 minutes. Its 7-day average is 29 minutes, so today ranks #5 for this week. Its 30-day average is 30 minutes, so today ranks #24 for the past month. Its 365-day average is 45 minutes, so today ranks #172 for the past year.
Slinky Dog Dash had an average wait time today of 65 minutes. Its 7-day average is 67 minutes, so today ranks #4 for this week. Its 30-day average is 67 minutes, so today ranks #20 for the past month.
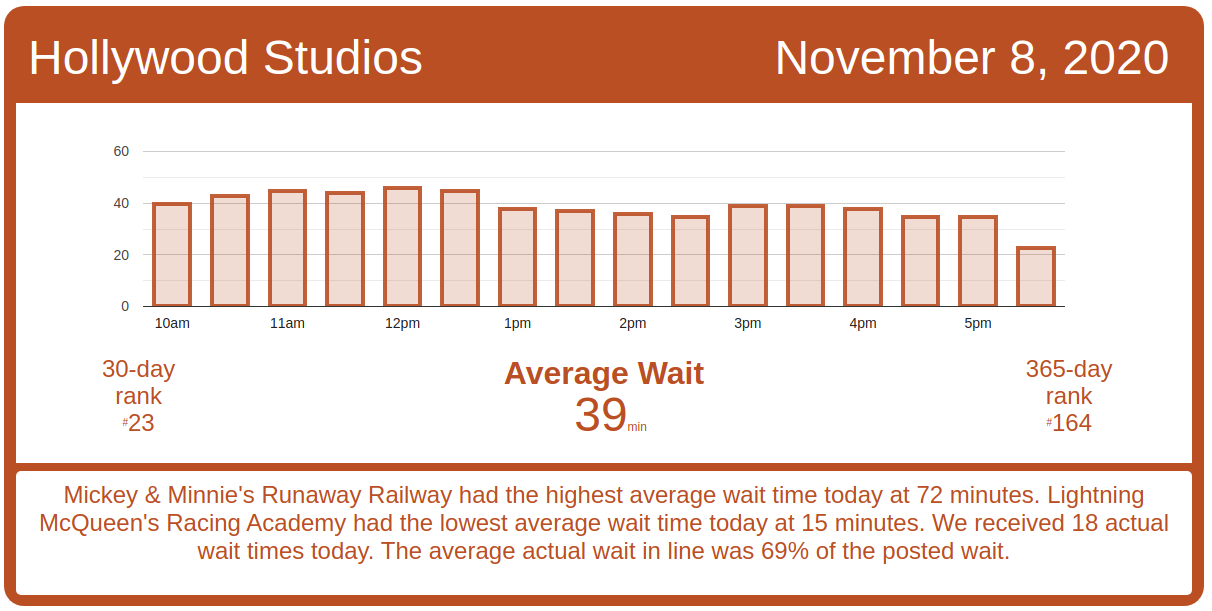
Millennium Falcon: Smugglers Run had an average wait time today of 51 minutes. Its 7-day average is 57 minutes, so today ranks #5 for this week. Its 30-day average is 58 minutes, so today ranks #23 for the past month.
Rise of the Resistance had a pretty good day of operations on Sunday, with many boarding groups being called earlier than they’ve been called all week:

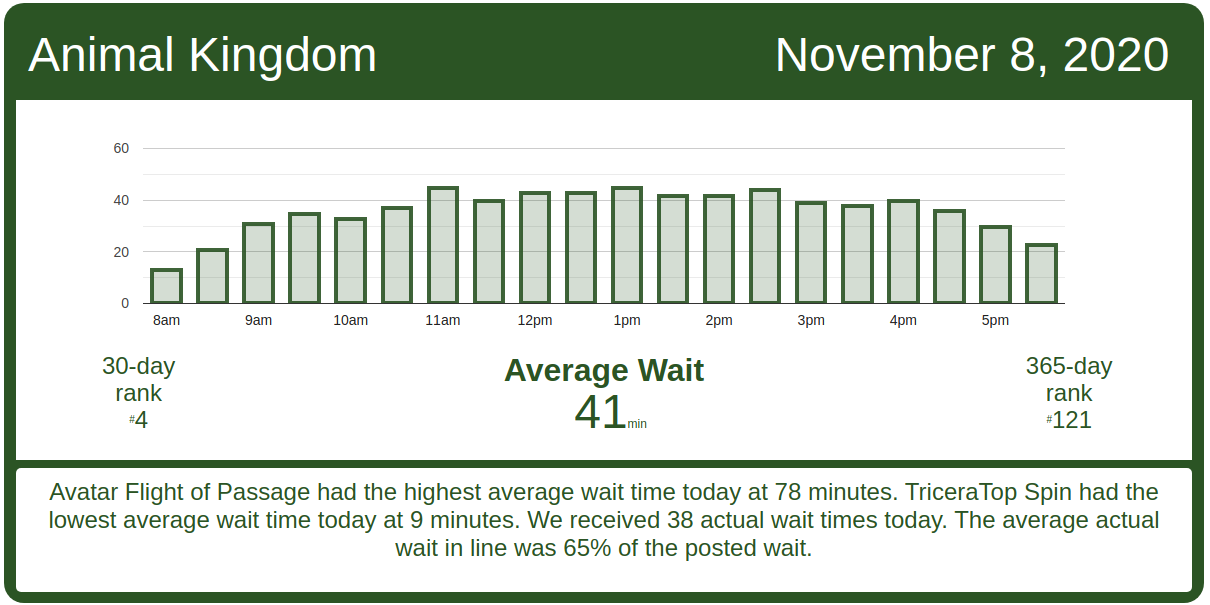
Animal Kingdom Wait Times
DINOSAUR had an average wait time today of 50 minutes. Its 7-day average is 30 minutes, so today ranks #1 for this week. Its 30-day average is 33 minutes, so today ranks #2 for the past month. We received 5 actual wait times today, and the actual wait averaged 87% of the posted wait time.
Expedition Everest had an average wait time today of 56 minutes. Its 7-day average is 33 minutes, so today ranks #1 for this week. Its 30-day average is 33 minutes, so today ranks #1 for the past month. We received 8 actual wait times today, and the actual wait averaged 58% of the posted wait time.
Kali River Rapids had an average wait time today of 18 minutes. Its 7-day average is 21 minutes, so today ranks #5 for this week. Its 30-day average is 24 minutes, so today ranks #19 for the past month.
Kilimanjaro Safaris had an average wait time today of 38 minutes. Its 7-day average is 22 minutes, so today ranks #1 for this week. Its 30-day average is 22 minutes, so today ranks #1 for the past month. We received 11 actual wait times today, and the actual wait averaged 48% of the posted wait time.
Na’vi River Journey had an average wait time today of 57 minutes. Its 7-day average is 46 minutes, so today ranks #1 for this week. Its 30-day average is 47 minutes, so today ranks #5 for the past month. Its 365-day average is 60 minutes, so today ranks #129 for the past year. We received 5 actual wait times today, and the actual wait averaged 74% of the posted wait time.
Avatar Flight of Passage had an average wait time today of 78 minutes. Its 7-day average is 52 minutes, so today ranks #1 for this week. Its 30-day average is 63 minutes, so today ranks #6 for the past month. Its 365-day average is 99 minutes, so today ranks #136 for the past year. We received 5 actual wait times today, and the actual wait averaged 72% of the posted wait time.
The post Crowds at EPCOT and Animal Kingdom – Walt Disney World Wait Times for Sunday, November 11, 2020 appeared first on TouringPlans.com Blog.