Disney World Wait Times for Wednesday, December 23, 2020

Posted wait times were high across Walt Disney World today, but actual wait times were often much, much lower.  We counted 486 of 500 guests (97%) wearing masks in the Magic Kingdom in accordance with Disney’s guidelines.  And we got 170 actual wait times from folks using our Lines app in the parks.  Let’s do the numbers!

Magic Kingdom Wait Times

Although Seven Dwarfs’ posted wait time averaged 101 minutes today, the actual wait times we observed were a third lower than that.  Seven Dwarfs Mine Train had an average wait time today of 101 minutes. Its 7-day average is 85 minutes, so today ranks #1 for this week. Its 30-day average is 74 minutes, so today ranks #1 for the past month. Its 365-day average is 76 minutes, so today ranks #79 for the past year. We received 4 actual wait times today, and the actual wait averaged 66% of the posted wait time.

Wait times at Peter Pan’s Flight were pretty accurate today.  Pan had an average posted wait time today of 49 minutes, and the actual wait averaged 96% of the posted wait time.

Magic Kingdom wait times for Wednesday, December 23, 2020

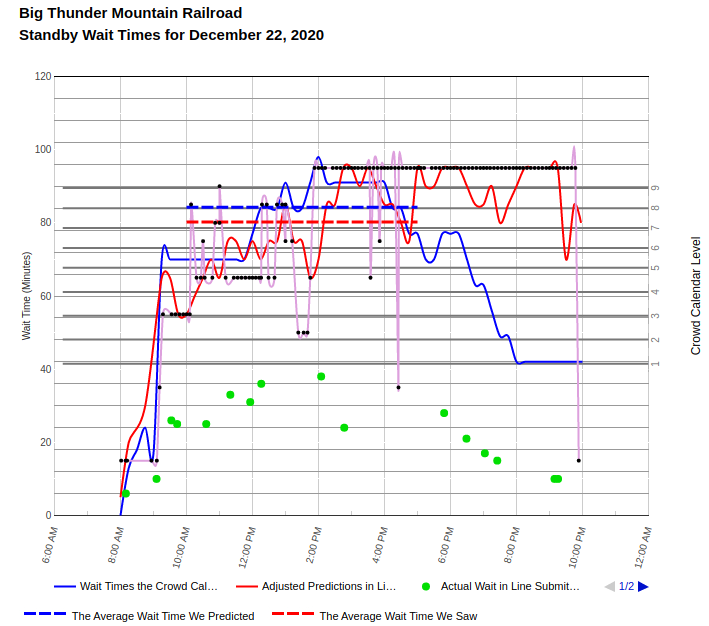
Here’s another example of inflated wait times at the Magic Kingdom from yesterday.  Big Thunder’s posted wait times were as high as 105 minutes, and never got below 45 minutes.  However, the longest actual wait in line we observed was 38 minutes at 2:04 p.m.  And the actual wait time when the posted wait was 105 minutes was just 17 minutes!

Big Thunder Mountain Railroad posted (black) and actual (green) wait times from Tuesday, December 22, 2020


Astro Orbiter
Average Posted Wait
48
7-Day Rank
#2
30-Day Rank
#2
365-Day Rank
#6
Big Thunder Mountain Railroad
Average Posted Wait
64
Actual Waits Were
44%
7-Day Rank
#2
30-Day Rank
#3
365-Day Rank
#58
Buzz Lightyear’s Space Ranger Spin
Average Posted Wait
47
Actual Waits Were
64%
7-Day Rank
#1
30-Day Rank
#1
365-Day Rank
#61
Dumbo the Flying Elephant
Average Posted Wait
24
7-Day Rank
#3
30-Day Rank
#3
365-Day Rank
#74
“it’s a small world”
Average Posted Wait
58
7-Day Rank
#1
30-Day Rank
#1
365-Day Rank
#1
Jungle Cruise
Average Posted Wait
62
7-Day Rank
#1
30-Day Rank
#1
365-Day Rank
#73
Mad Tea Party
Average Posted Wait
23
7-Day Rank
#2
30-Day Rank
#2
365-Day Rank
#37
Mickey’s PhilharMagic
Average Posted Wait
41
7-Day Rank
#1
30-Day Rank
#1
365-Day Rank
#1
Peter Pan’s Flight
Average Posted Wait
49
Actual Waits Were
96%
7-Day Rank
#1
30-Day Rank
#1
365-Day Rank
#82
Pirates of the Caribbean
Average Posted Wait
60
Actual Waits Were
64%
7-Day Rank
#2
30-Day Rank
#2
365-Day Rank
#19
Space Mountain
Average Posted Wait
63
Actual Waits Were
68%
7-Day Rank
#2
30-Day Rank
#3
365-Day Rank
#82
Splash Mountain
Average Posted Wait
91
7-Day Rank
#1
30-Day Rank
#1
365-Day Rank
#12
The Barnstormer
Average Posted Wait
34
Actual Waits Were
83%
7-Day Rank
#3
30-Day Rank
#3
365-Day Rank
#59
The Haunted Mansion
Average Posted Wait
29
Actual Waits Were
58%
7-Day Rank
#2
30-Day Rank
#11
365-Day Rank
#153
The Magic Carpets of Aladdin
Average Posted Wait
17
7-Day Rank
#2
30-Day Rank
#2
365-Day Rank
#90
The Many Adventures of Winnie the Pooh
Average Posted Wait
31
7-Day Rank
#2
30-Day Rank
#3
365-Day Rank
#89
Tomorrowland Speedway
Average Posted Wait
31
7-Day Rank
#3
30-Day Rank
#3
365-Day Rank
#60
Seven Dwarfs Mine Train
Average Posted Wait
101
Actual Waits Were
66%
7-Day Rank
#1
30-Day Rank
#1
365-Day Rank
#79
Under the Sea ~ Journey of the Little Mermaid
Average Posted Wait
29
7-Day Rank
#3
30-Day Rank
#4
365-Day Rank
#72

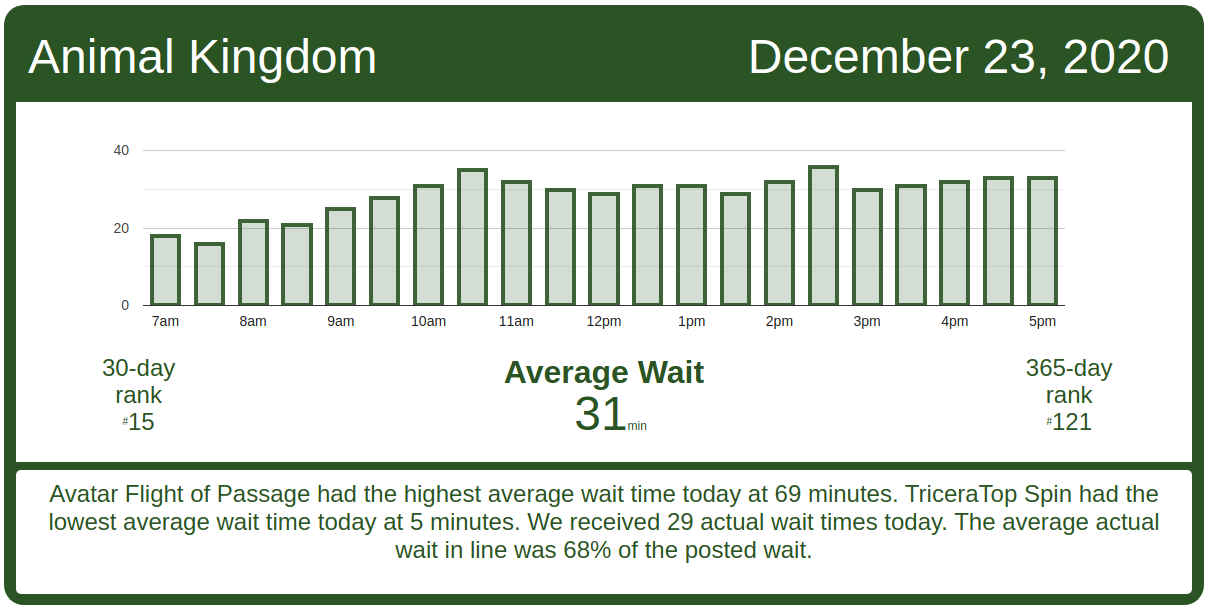
Animal Kingdom Wait Times

Avatar Flight of Passage had an average wait time today of 69 minutes. Its 7-day average is 74 minutes, so today ranks #3 for this week. Its 30-day average is 69 minutes, so today ranks #11 for the past month. Its 365-day average is 84 minutes, so today ranks #112 for the past year. We received 6 actual wait times today, and the actual wait averaged 87% of the posted wait time.

Wait times at Kilimanjaro Safaris and Expedition Everest continue to be overinflated.  Expedition Everest had an average wait time today of 25 minutes. Its 7-day average is 30 minutes, so today ranks #4 for this week. Its 30-day average is 36 minutes, so today ranks #19 for the past month. We received 11 actual wait times today, and the actual wait averaged just 35% of the posted wait time.

Animal Kingdom wait times for Wednesday, December 23, 2020
DINOSAUR
Average Posted Wait
39
7-Day Rank
#4
30-Day Rank
#17
365-Day Rank
#101
Expedition Everest – Legend of the Forbidden Mountain
Average Posted Wait
25
Actual Waits Were
35%
7-Day Rank
#4
30-Day Rank
#19
365-Day Rank
#155
Kali River Rapids
Average Posted Wait
23
7-Day Rank
#1
30-Day Rank
#7
365-Day Rank
#47
Kilimanjaro Safaris
Average Posted Wait
17
Actual Waits Were
47%
7-Day Rank
#4
30-Day Rank
#23
365-Day Rank
#172
It’s Tough to Be a Bug!
Average Posted Wait
20
7-Day Rank
#4
30-Day Rank
#17
365-Day Rank
#38
TriceraTop Spin
Average Posted Wait
5
7-Day Rank
#2
30-Day Rank
#18
365-Day Rank
#111
Na’vi River Journey
Average Posted Wait
56
7-Day Rank
#3
30-Day Rank
#12
365-Day Rank
#101
Avatar Flight of Passage
Average Posted Wait
69
Actual Waits Were
87%
7-Day Rank
#3
30-Day Rank
#11
365-Day Rank
#112

Hollywood Studios Wait Times

Millennium Falcon: Smugglers Run had an average wait time today of 63 minutes. Its 7-day average is 78 minutes, so today ranks #6 for this week. Its 30-day average is 59 minutes, so today ranks #10 for the past month. Its 365-day average is 61 minutes, so today ranks #96 for the past year. We received 5 actual wait times today, and the actual wait averaged 80% of the posted wait time.

Hollywood Studios wait times for Wednesday, December 23, 2020

Rise of the Resistance had a solid day of operations, calling more than 110 boarding groups until hitting a rough patch around 3 p.m. That’s the normal time of day for Rise to stop calling boarding groups, presumably for some kind of maintenance.  However, when Rise restarted calling boarding groups around 3:30 p.m., that only lasted about 10 minutes before another delay of around 50 minutes happened.  Still, Rise is running slightly ahead of its best speed over the last 7 days, so things overall are good.

Rise of the Resistance boarding groups for Wednesday, December 23, 2020
Muppet*Vision 3D
Average Posted Wait
30
7-Day Rank
#4
30-Day Rank
#7
365-Day Rank
#7
Rock ‘n’ Roller Coaster Starring Aerosmith
Average Posted Wait
42
7-Day Rank
#4
30-Day Rank
#18
365-Day Rank
#166
Star Tours: The Adventures Continue
Average Posted Wait
33
Actual Waits Were
41%
7-Day Rank
#6
30-Day Rank
#9
365-Day Rank
#60
The Twilight Zone Tower of Terror
Average Posted Wait
61
7-Day Rank
#6
30-Day Rank
#12
365-Day Rank
#85
Toy Story Mania!
Average Posted Wait
30
Actual Waits Were
87%
7-Day Rank
#4
30-Day Rank
#5
365-Day Rank
#116
Slinky Dog Dash
Average Posted Wait
63
7-Day Rank
#3
30-Day Rank
#18
365-Day Rank
#148
Alien Swirling Saucers
Average Posted Wait
32
7-Day Rank
#4
30-Day Rank
#5
365-Day Rank
#75
Mickey & Minnie’s Runaway Railway
Average Posted Wait
48
Actual Waits Were
65%
7-Day Rank
#3
30-Day Rank
#13
365-Day Rank
#141
Millennium Falcon: Smugglers Run
Average Posted Wait
63
Actual Waits Were
80%
7-Day Rank
#6
30-Day Rank
#10
365-Day Rank
#96

EPCOT Wait Times

Actual wait times at EPCOT continue to average around half of the posted waits.  Test Track had an average wait time today of 54 minutes. Its 7-day average is 69 minutes, so today ranks #6 for this week. Its 30-day average is 69 minutes, so today ranks #26 for the past month. Its 365-day average is 57 minutes, so today ranks #98 for the past year. We received 11 actual wait times today, and the actual wait averaged 47% of the posted wait time.

EPCOT wait times for Wednesday, December 23, 2020
Gran Fiesta Tour Starring The Three Caballeros
Average Posted Wait
5
7-Day Rank
#6
30-Day Rank
#30
365-Day Rank
#222
Journey Into Imagination With Figment
Average Posted Wait
11
Actual Waits Were
40%
7-Day Rank
#6
30-Day Rank
#26
365-Day Rank
#154
Living with the Land
Average Posted Wait
8
Actual Waits Were
20%
7-Day Rank
#5
30-Day Rank
#28
365-Day Rank
#231
Mission: SPACE Orange
Average Posted Wait
35
7-Day Rank
#3
30-Day Rank
#9
365-Day Rank
#60
Soarin’
Average Posted Wait
27
Actual Waits Were
58%
7-Day Rank
#6
30-Day Rank
#28
365-Day Rank
#164
Spaceship Earth
Average Posted Wait
15
Actual Waits Were
60%
7-Day Rank
#4
30-Day Rank
#24
365-Day Rank
#143
Test Track
Average Posted Wait
54
Actual Waits Were
47%
7-Day Rank
#6
30-Day Rank
#26
365-Day Rank
#98
The Seas with Nemo & Friends
Average Posted Wait
6
Actual Waits Were
33%
7-Day Rank
#6
30-Day Rank
#28
365-Day Rank
#232
Mission: SPACE Green
Average Posted Wait
10
7-Day Rank
#6
30-Day Rank
#28
365-Day Rank
#181
Frozen Ever After
Average Posted Wait
22
Actual Waits Were
87%
7-Day Rank
#6
30-Day Rank
#29
365-Day Rank
#239

The post Disney World Wait Times for Wednesday, December 23, 2020 appeared first on TouringPlans.com Blog.