Studios is The Busiest park – Disney World Wait Times for Thursday, December 17, 2020

Wait times were moderate at Magic Kingdom, EPCOT, and Animal Kingdom today, while the Studios was somewhat busier.  We counted 489 of 500 guests (98%) at the Magic Kingdom wearing masks in accordance with Disney’s guidelines.  And we received 129 actual wait times today from folks using our Lines app!  Let’s do the numbers!

Magic Kingdom Wait Times

Temperatures cooled off here in Central Florida on Thursday, and wait times at water rides dropped as a result.  Splash Mountain had an average wait time today of 28 minutes. Its 7-day average is 47 minutes, so today ranks #6 for this week. Its 30-day average is 51 minutes, so today ranks #24 for the past month. Its 365-day average is 53 minutes, so today ranks #169 for the past year. We received 5 actual wait times today, and the actual wait averaged 44% of the posted wait time.

Magic Kingdom wait times for Thursday, December 17, 2020
Astro Orbiter
Average Posted Wait
35
7-Day Rank
#4
30-Day Rank
#21
365-Day Rank
#81
Big Thunder Mountain Railroad
Average Posted Wait
49
Actual Waits Were
65%
7-Day Rank
#4
30-Day Rank
#18
365-Day Rank
#110
Buzz Lightyear’s Space Ranger Spin
Average Posted Wait
39
7-Day Rank
#5
30-Day Rank
#14
365-Day Rank
#105
Prince Charming Regal Carrousel
Average Posted Wait
40
7-Day Rank
#1
30-Day Rank
#1
365-Day Rank
#1
Dumbo the Flying Elephant
Average Posted Wait
10
7-Day Rank
#5
30-Day Rank
#25
365-Day Rank
#150
“it’s a small world”
Average Posted Wait
44
7-Day Rank
#1
30-Day Rank
#8
365-Day Rank
#47
Jungle Cruise
Average Posted Wait
43
Actual Waits Were
78%
7-Day Rank
#5
30-Day Rank
#20
365-Day Rank
#132
Mad Tea Party
Average Posted Wait
15
7-Day Rank
#4
30-Day Rank
#17
365-Day Rank
#104
Mickey’s PhilharMagic
Average Posted Wait
32
7-Day Rank
#2
30-Day Rank
#4
365-Day Rank
#4
Peter Pan’s Flight
Average Posted Wait
40
7-Day Rank
#3
30-Day Rank
#8
365-Day Rank
#107
Pirates of the Caribbean
Average Posted Wait
46
Actual Waits Were
84%
7-Day Rank
#5
30-Day Rank
#19
365-Day Rank
#118
Space Mountain
Average Posted Wait
47
Actual Waits Were
63%
7-Day Rank
#3
30-Day Rank
#14
365-Day Rank
#118
Splash Mountain
Average Posted Wait
28
Actual Waits Were
44%
7-Day Rank
#6
30-Day Rank
#24
365-Day Rank
#169
The Barnstormer
Average Posted Wait
25
7-Day Rank
#4
30-Day Rank
#19
365-Day Rank
#101
The Haunted Mansion
Average Posted Wait
28
Actual Waits Were
68%
7-Day Rank
#3
30-Day Rank
#12
365-Day Rank
#161
The Magic Carpets of Aladdin
Average Posted Wait
14
7-Day Rank
#2
30-Day Rank
#14
365-Day Rank
#131
The Many Adventures of Winnie the Pooh
Average Posted Wait
28
7-Day Rank
#5
30-Day Rank
#12
365-Day Rank
#112
Tomorrowland Speedway
Average Posted Wait
17
7-Day Rank
#3
30-Day Rank
#14
365-Day Rank
#128
Seven Dwarfs Mine Train
Average Posted Wait
68
Actual Waits Were
78%
7-Day Rank
#5
30-Day Rank
#19
365-Day Rank
#115
Under the Sea ~ Journey of the Little Mermaid
Average Posted Wait
25
Actual Waits Were
35%
7-Day Rank
#5
30-Day Rank
#15
365-Day Rank
#117

Since our team was in Magic Kingdom today let’s look at how Main Street USA looked this afternoon.

Main Street USA – December 17, 2020
Main Street USA – December 17, 2020 (Emporium Line Starts Here)
Cinderella Castle – December 17, 2020

Animal Kingdom Wait Times

Similarly, over at Animal Kingdom, Kali River Rapids had an average wait time today of 9 minutes. Its 7-day average is 15 minutes, so today ranks #6 for this week. Its 30-day average is 20 minutes, so today ranks #29 for the past month. Its 365-day average is 21 minutes, so today ranks #157 for the past year.

Animal Kingdom wait times for Thursday, December 17, 2020
DINOSAUR
Average Posted Wait
41
7-Day Rank
#3
30-Day Rank
#12
365-Day Rank
#88
Expedition Everest – Legend of the Forbidden Mountain
Average Posted Wait
20
7-Day Rank
#5
30-Day Rank
#26
365-Day Rank
#183
Kali River Rapids
Average Posted Wait
9
7-Day Rank
#6
30-Day Rank
#29
365-Day Rank
#157
Kilimanjaro Safaris
Average Posted Wait
32
Actual Waits Were
64%
7-Day Rank
#3
30-Day Rank
#7
365-Day Rank
#101
It’s Tough to Be a Bug!
Average Posted Wait
24
7-Day Rank
#3
30-Day Rank
#8
365-Day Rank
#12
TriceraTop Spin
Average Posted Wait
5
7-Day Rank
#2
30-Day Rank
#21
365-Day Rank
#115
Na’vi River Journey
Average Posted Wait
55
7-Day Rank
#3
30-Day Rank
#11
365-Day Rank
#108
Avatar Flight of Passage
Average Posted Wait
69
7-Day Rank
#2
30-Day Rank
#10
365-Day Rank
#117

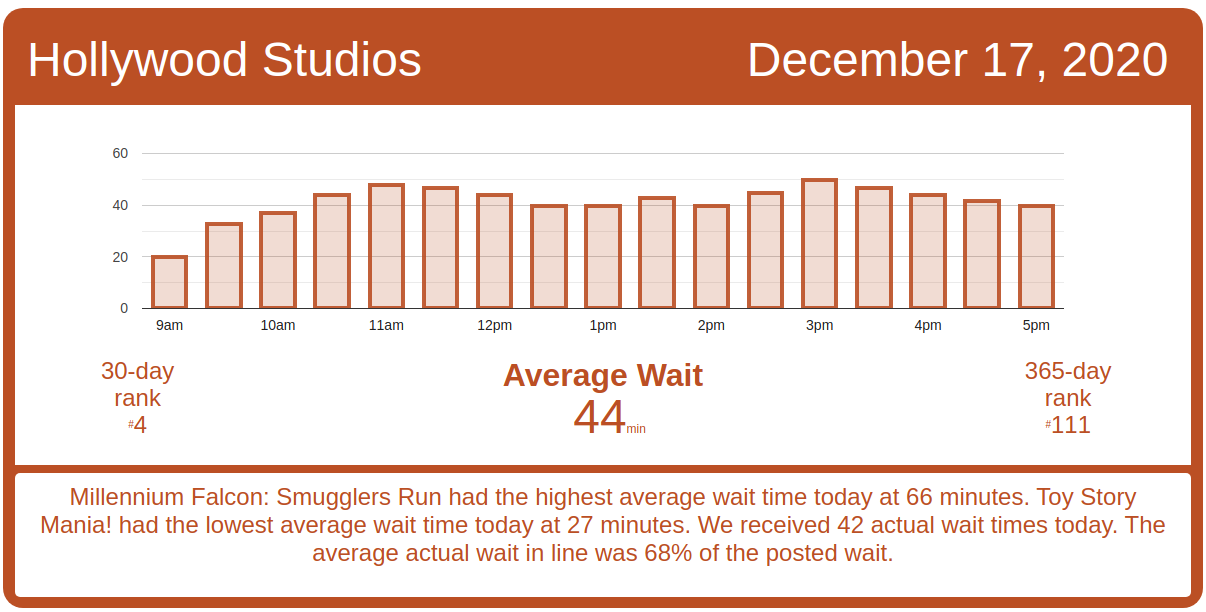
Hollywood Studios Wait Times

Actual wait times at Millennium Falcon: Smugglers Run continue to track the posted wait times pretty well:  Falcon had an average wait time today of 66 minutes. Its 7-day average is 57 minutes, so today ranks #1 for this week. Its 30-day average is 54 minutes, so today ranks #1 for the past month. We received 7 actual wait times today, and the actual wait averaged 88% of the posted wait time.

Hollywood Studios wait times for Thursday, December 17, 2020

Rise of the Resistance had a much better day of operations today.  Rise started calling boarding groups around 8:45 a.m. today, and made steady progress through boarding group 92 at 2 p.m., when boarding stopped for its usual afternoon break. (It’s normally around 3 p.m. when the park opens at 10 a.m., but the park opened at 9 a.m. today, so the break was an hour earlier.)  Good day at Rise of the Resistance.

Rise of the Resistance boarding groups for Thursday, December 17, 2020
Muppet*Vision 3D
Average Posted Wait
34
7-Day Rank
#1
30-Day Rank
#1
365-Day Rank
#1
Rock ‘n’ Roller Coaster Starring Aerosmith
Average Posted Wait
42
Actual Waits Were
58%
7-Day Rank
#1
30-Day Rank
#20
365-Day Rank
#168
Star Tours: The Adventures Continue
Average Posted Wait
36
Actual Waits Were
50%
7-Day Rank
#1
30-Day Rank
#1
365-Day Rank
#39
The Twilight Zone Tower of Terror
Average Posted Wait
65
Actual Waits Were
86%
7-Day Rank
#1
30-Day Rank
#1
365-Day Rank
#67
Toy Story Mania!
Average Posted Wait
27
Actual Waits Were
67%
7-Day Rank
#2
30-Day Rank
#9
365-Day Rank
#140
Slinky Dog Dash
Average Posted Wait
56
7-Day Rank
#1
30-Day Rank
#23
365-Day Rank
#170
Alien Swirling Saucers
Average Posted Wait
30
7-Day Rank
#1
30-Day Rank
#1
365-Day Rank
#89
Mickey & Minnie’s Runaway Railway
Average Posted Wait
51
Actual Waits Were
57%
7-Day Rank
#1
30-Day Rank
#9
365-Day Rank
#126
Millennium Falcon: Smugglers Run
Average Posted Wait
66
Actual Waits Were
88%
7-Day Rank
#1
30-Day Rank
#1
365-Day Rank
#74
Lightning McQueen’s Racing Academy
Average Posted Wait
38
7-Day Rank
#1
30-Day Rank
#2
365-Day Rank
#2

EPCOT Wait Times

Frozen Ever After had an average wait time today of 69 minutes. Its 7-day average is 82 minutes, so today ranks #6 for this week. Its 30-day average is 77 minutes, so today ranks #22 for the past month. Its 365-day average is 60 minutes, so today ranks #80 for the past year.

EPCOT wait times for Thursday, December 17, 2020
Gran Fiesta Tour Starring The Three Caballeros
Average Posted Wait
6
7-Day Rank
#5
30-Day Rank
#24
365-Day Rank
#184
Journey Into Imagination With Figment
Average Posted Wait
17
7-Day Rank
#4
30-Day Rank
#14
365-Day Rank
#97
Living with the Land
Average Posted Wait
14
7-Day Rank
#4
30-Day Rank
#9
365-Day Rank
#96
Mission: SPACE Orange
Average Posted Wait
35
7-Day Rank
#1
30-Day Rank
#8
365-Day Rank
#63
Soarin’
Average Posted Wait
50
7-Day Rank
#2
30-Day Rank
#12
365-Day Rank
#60
Spaceship Earth
Average Posted Wait
25
7-Day Rank
#2
30-Day Rank
#12
365-Day Rank
#81
Test Track
Average Posted Wait
67
7-Day Rank
#2
30-Day Rank
#13
365-Day Rank
#59
The Seas with Nemo & Friends
Average Posted Wait
14
7-Day Rank
#3
30-Day Rank
#10
365-Day Rank
#110
Frozen Ever After
Average Posted Wait
69
7-Day Rank
#6
30-Day Rank
#22
365-Day Rank
#80

The post Studios is The Busiest park – Disney World Wait Times for Thursday, December 17, 2020 appeared first on TouringPlans.com Blog.