Low Holiday Crowds – Disney World Wait Times for Monday, January 18, 2021

It looks like crowds stayed away from Walt Disney World on Martin Luther King, Jr Day today.  Wait times at all four Disney World parks rank only as high as #21 out of the past 30 days. We received 136 actual wait times today from fabulous users of our Lines app.  And we counted 4 of 500 guests (99%) at Animal Kingdom wearing masks in accordance with Disney’s guidelines.  Let’s do the rest of the numbers!

Magic Kingdom Wait Times

There was a wide spread in the accuracy of posted wait times at the Magic Kingdom today.  For example, Space Mountain had an average wait time today of 36 minutes.  We received 7 actual wait times today, and the actual wait averaged 55% of the posted wait time.  But Splash Mountain had an average wait time today of 37 minutes, and the 5 actual wait times we got today averaged 103% of the posted wait time.

Magic Kingdom wait times for Monday, January 18, 2021
Astro Orbiter
Average Posted Wait
42
7-Day Rank
#2
30-Day Rank
#12
365-Day Rank
#20
Big Thunder Mountain Railroad
Average Posted Wait
45
Actual Waits Were
52%
7-Day Rank
#3
30-Day Rank
#26
365-Day Rank
#137
Buzz Lightyear’s Space Ranger Spin
Average Posted Wait
29
7-Day Rank
#3
30-Day Rank
#25
365-Day Rank
#143
Dumbo the Flying Elephant
Average Posted Wait
10
7-Day Rank
#3
30-Day Rank
#21
365-Day Rank
#152
“it’s a small world”
Average Posted Wait
36
7-Day Rank
#2
30-Day Rank
#24
365-Day Rank
#129
Jungle Cruise
Average Posted Wait
33
7-Day Rank
#4
30-Day Rank
#26
365-Day Rank
#178
Mad Tea Party
Average Posted Wait
12
7-Day Rank
#4
30-Day Rank
#21
365-Day Rank
#140
Mickey’s PhilharMagic
Average Posted Wait
21
7-Day Rank
#3
30-Day Rank
#24
365-Day Rank
#39
Peter Pan’s Flight
Average Posted Wait
30
7-Day Rank
#3
30-Day Rank
#24
365-Day Rank
#152
Pirates of the Caribbean
Average Posted Wait
40
Actual Waits Were
79%
7-Day Rank
#3
30-Day Rank
#25
365-Day Rank
#159
Space Mountain
Average Posted Wait
36
Actual Waits Were
55%
7-Day Rank
#3
30-Day Rank
#25
365-Day Rank
#141
Splash Mountain
Average Posted Wait
37
Actual Waits Were
103%
7-Day Rank
#3
30-Day Rank
#23
365-Day Rank
#148
The Barnstormer
Average Posted Wait
23
7-Day Rank
#2
30-Day Rank
#19
365-Day Rank
#107
The Haunted Mansion
Average Posted Wait
16
Actual Waits Were
76%
7-Day Rank
#3
30-Day Rank
#26
365-Day Rank
#209
The Magic Carpets of Aladdin
Average Posted Wait
11
7-Day Rank
#4
30-Day Rank
#26
365-Day Rank
#184
The Many Adventures of Winnie the Pooh
Average Posted Wait
20
7-Day Rank
#4
30-Day Rank
#26
365-Day Rank
#170
Tomorrowland Speedway
Average Posted Wait
14
7-Day Rank
#4
30-Day Rank
#23
365-Day Rank
#148
Seven Dwarfs Mine Train
Average Posted Wait
64
7-Day Rank
#2
30-Day Rank
#23
365-Day Rank
#119
Under the Sea ~ Journey of the Little Mermaid
Average Posted Wait
20
7-Day Rank
#2
30-Day Rank
#19
365-Day Rank
#141

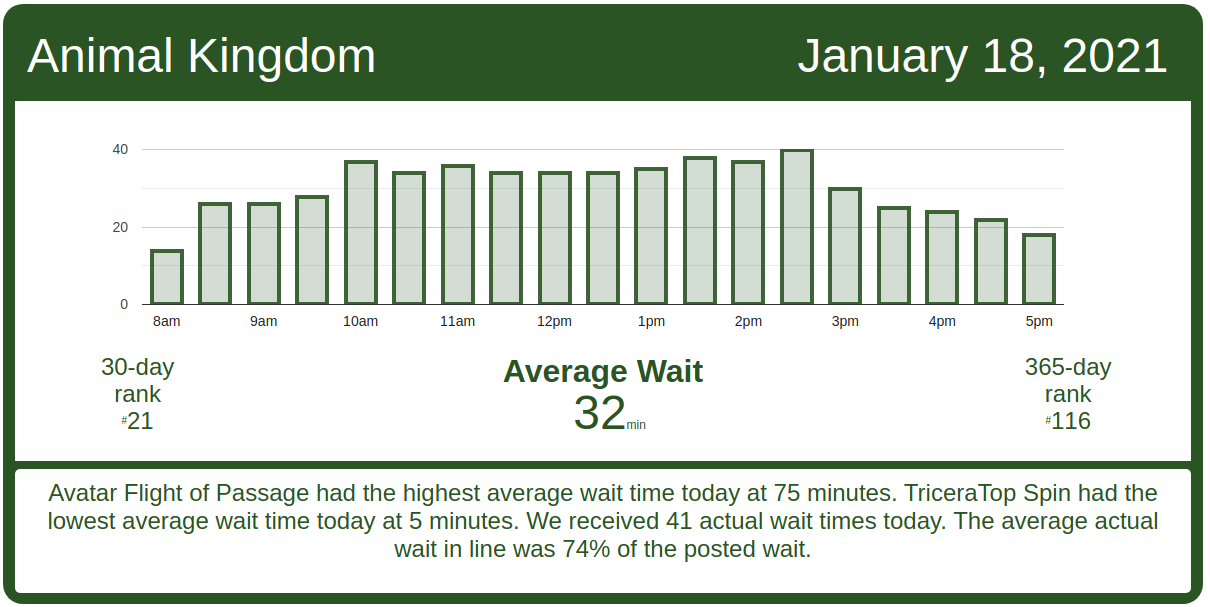
Animal Kingdom Wait Times

Expedition Everest – Legend of the Forbidden Mountain had an average wait time today of 23 minutes. Its 7-day average is 19 minutes, so today ranks #2 for this week. Its 30-day average is 30 minutes, so today ranks #20 for the past month. Its 365-day average is 37 minutes, so today ranks #157 for the past year. We received 13 actual wait times today, and the actual wait averaged 52% of the posted wait time.

Animal Kingdom wait times for Monday, January 18, 2021
DINOSAUR
Average Posted Wait
39
Actual Waits Were
94%
7-Day Rank
#2
30-Day Rank
#19
365-Day Rank
#98
Expedition Everest – Legend of the Forbidden Mountain
Average Posted Wait
23
Actual Waits Were
52%
7-Day Rank
#2
30-Day Rank
#20
365-Day Rank
#157
Kilimanjaro Safaris
Average Posted Wait
19
Actual Waits Were
42%
7-Day Rank
#2
30-Day Rank
#18
365-Day Rank
#136
It’s Tough to Be a Bug!
Average Posted Wait
15
7-Day Rank
#3
30-Day Rank
#20
365-Day Rank
#76
TriceraTop Spin
Average Posted Wait
5
7-Day Rank
#1
30-Day Rank
#10
365-Day Rank
#97
Na’vi River Journey
Average Posted Wait
50
7-Day Rank
#2
30-Day Rank
#22
365-Day Rank
#111
Avatar Flight of Passage
Average Posted Wait
75
Actual Waits Were
89%
7-Day Rank
#1
30-Day Rank
#9
365-Day Rank
#85

Hollywood Studios Wait Times

Toy Story Mania! had an average wait time today of 31 minutes. Its 7-day average is 27 minutes, so today ranks #2 for this week. Its 30-day average is 33 minutes, so today ranks #20 for the past month. Its 365-day average is 34 minutes, so today ranks #96 for the past year. We received 6 actual wait times today, and the actual wait averaged 56% of the posted wait time.

Hollywood Studios wait times for Monday, January 18, 2021

It’s been a rough day over at Rise of the Resistance, with multiple delays in calling boarding groups. It looks like Rise had delays in calling boarding groups around 11 a.m. for about half an hour, another delay at 1:30 p.m. for almost an hour, and a third delay at 3 p.m. for another 45 minutes.  At this rate, Rise of the Resistance might not get to 140 boarding groups, which is 30 below the best day it’s had over the past week.

Rise of the Resistance boarding groups for Monday, January 18, 2021
Muppet*Vision 3D
Average Posted Wait
26
7-Day Rank
#4
30-Day Rank
#25
365-Day Rank
#36
Rock ‘n’ Roller Coaster Starring Aerosmith
Average Posted Wait
36
Actual Waits Were
61%
7-Day Rank
#3
30-Day Rank
#25
365-Day Rank
#179
Star Tours: The Adventures Continue
Average Posted Wait
36
Actual Waits Were
61%
7-Day Rank
#1
30-Day Rank
#18
365-Day Rank
#42
The Twilight Zone Tower of Terror
Average Posted Wait
52
Actual Waits Were
75%
7-Day Rank
#3
30-Day Rank
#26
365-Day Rank
#105
Toy Story Mania!
Average Posted Wait
31
Actual Waits Were
56%
7-Day Rank
#2
30-Day Rank
#20
365-Day Rank
#96
Slinky Dog Dash
Average Posted Wait
76
7-Day Rank
#1
30-Day Rank
#4
365-Day Rank
#67
Alien Swirling Saucers
Average Posted Wait
26
Actual Waits Were
51%
7-Day Rank
#1
30-Day Rank
#19
365-Day Rank
#111
Mickey & Minnie’s Runaway Railway
Average Posted Wait
49
7-Day Rank
#1
30-Day Rank
#9
365-Day Rank
#146
Millennium Falcon: Smugglers Run
Average Posted Wait
55
Actual Waits Were
81%
7-Day Rank
#2
30-Day Rank
#22
365-Day Rank
#141

EPCOT Wait Times

Frozen Ever After had an average wait time today of 32 minutes. Its 7-day average is 27 minutes, so today ranks #2 for this week. Its 30-day average is 35 minutes, so today ranks #13 for the past month. Its 365-day average is 54 minutes, so today ranks #190 for the past year. We received 4 actual wait times today, and the actual wait averaged 67% of the posted wait time.

EPCOT wait times for Monday, January 18, 2021
Gran Fiesta Tour Starring The Three Caballeros
Average Posted Wait
5
7-Day Rank
#4
30-Day Rank
#26
365-Day Rank
#225
Journey Into Imagination With Figment
Average Posted Wait
7
7-Day Rank
#2
30-Day Rank
#23
365-Day Rank
#180
Living with the Land
Average Posted Wait
8
7-Day Rank
#2
30-Day Rank
#17
365-Day Rank
#207
Mission: SPACE Orange
Average Posted Wait
25
7-Day Rank
#3
30-Day Rank
#25
365-Day Rank
#126
Soarin’
Average Posted Wait
34
7-Day Rank
#2
30-Day Rank
#18
365-Day Rank
#125
Spaceship Earth
Average Posted Wait
20
7-Day Rank
#1
30-Day Rank
#12
365-Day Rank
#108
Test Track
Average Posted Wait
60
7-Day Rank
#2
30-Day Rank
#18
365-Day Rank
#85
The Seas with Nemo & Friends
Average Posted Wait
10
7-Day Rank
#3
30-Day Rank
#16
365-Day Rank
#134
Frozen Ever After
Average Posted Wait
32
Actual Waits Were
67%
7-Day Rank
#2
30-Day Rank
#13
365-Day Rank
#190

The post Low Holiday Crowds – Disney World Wait Times for Monday, January 18, 2021 appeared first on TouringPlans.com Blog.