Moderate Crowds All Over – Disney World Wait Times for Saturday, January 9, 2021

It was a quiet day with moderate to low crowds across Walt Disney World today, with the Magic Kingdom and Animal Kingdom the busier of the four parks.  We received 140 actual wait times from fabulous users of our Lines app today.  Let’s do the numbers!

Magic Kingdom Wait Times

It was cool today in Orlando, with lows at 39F, so indoor rides were popular throughout the day.  Pirates of the Caribbean had an average wait time today of 55 minutes. Its 7-day average is 54 minutes, so today ranks #3 for this week. Its 365-day average is 43 minutes, so today ranks #48 for the past year. We received 4 actual wait times today, and the actual wait averaged 82% of the posted wait time.

Magic Kingdom wait times for Saturday, January 9, 2021
Astro Orbiter
Average Posted Wait
41
7-Day Rank
#1
30-Day Rank
#14
365-Day Rank
#26
Big Thunder Mountain Railroad
Average Posted Wait
61
Actual Waits Were
58%
7-Day Rank
#2
30-Day Rank
#10
365-Day Rank
#52
Buzz Lightyear’s Space Ranger Spin
Average Posted Wait
48
7-Day Rank
#1
30-Day Rank
#1
365-Day Rank
#42
Dumbo the Flying Elephant
Average Posted Wait
23
7-Day Rank
#1
30-Day Rank
#7
365-Day Rank
#70
“it’s a small world”
Average Posted Wait
53
7-Day Rank
#1
30-Day Rank
#4
365-Day Rank
#7
Jungle Cruise
Average Posted Wait
43
7-Day Rank
#3
30-Day Rank
#21
365-Day Rank
#125
Mad Tea Party
Average Posted Wait
19
7-Day Rank
#2
30-Day Rank
#10
365-Day Rank
#47
Mickey’s PhilharMagic
Average Posted Wait
36
7-Day Rank
#1
30-Day Rank
#1
365-Day Rank
#1
Peter Pan’s Flight
Average Posted Wait
49
7-Day Rank
#1
30-Day Rank
#7
365-Day Rank
#71
Pirates of the Caribbean
Average Posted Wait
55
Actual Waits Were
82%
7-Day Rank
#3
30-Day Rank
#14
365-Day Rank
#48
Splash Mountain
Average Posted Wait
51
7-Day Rank
#2
30-Day Rank
#17
365-Day Rank
#94
The Barnstormer
Average Posted Wait
35
7-Day Rank
#1
30-Day Rank
#8
365-Day Rank
#46
The Haunted Mansion
Average Posted Wait
32
Actual Waits Were
55%
7-Day Rank
#1
30-Day Rank
#5
365-Day Rank
#124
The Magic Carpets of Aladdin
Average Posted Wait
18
7-Day Rank
#1
30-Day Rank
#7
365-Day Rank
#78
The Many Adventures of Winnie the Pooh
Average Posted Wait
35
7-Day Rank
#1
30-Day Rank
#4
365-Day Rank
#65
Tomorrowland Speedway
Average Posted Wait
28
7-Day Rank
#3
30-Day Rank
#10
365-Day Rank
#65
Seven Dwarfs Mine Train
Average Posted Wait
83
7-Day Rank
#2
30-Day Rank
#10
365-Day Rank
#79
Under the Sea ~ Journey of the Little Mermaid
Average Posted Wait
33
7-Day Rank
#1
30-Day Rank
#4
365-Day Rank
#42

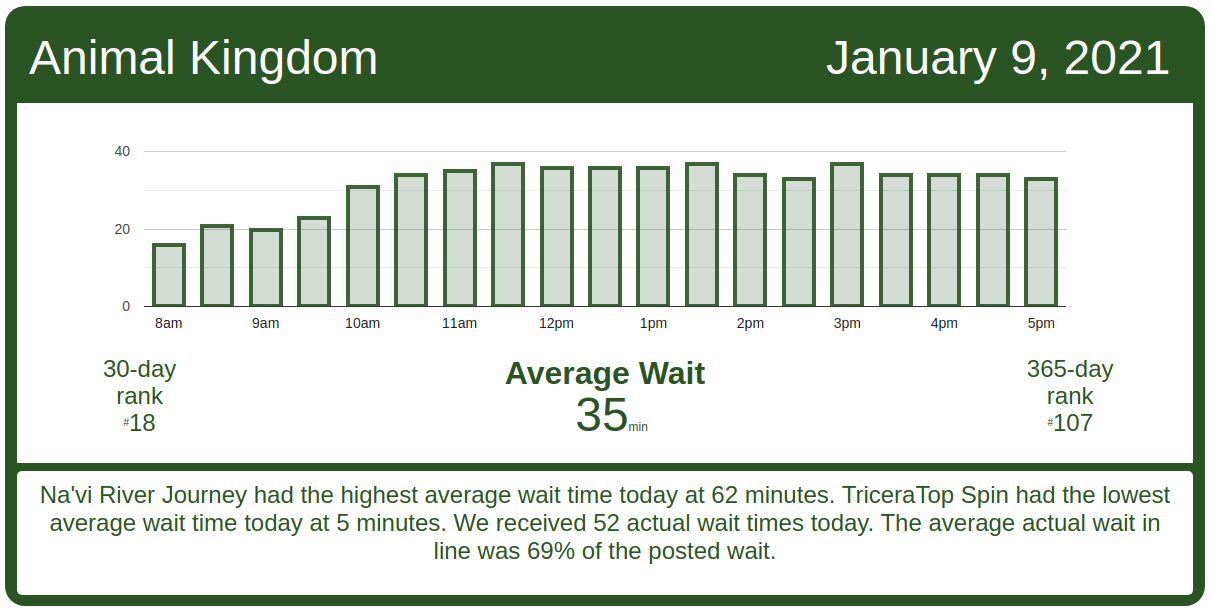
Animal Kingdom Wait Times

Avatar Flight of Passage had an average wait time today of 58 minutes. Its 7-day average is 59 minutes, so today ranks #4 for this week. Its 30-day average is 70 minutes, so today ranks #22 for the past month. Its 365-day average is 75 minutes, so today ranks #127 for the past year. We received 14 actual wait times today, and the actual wait averaged 82% of the posted wait time.

In contrast, Expedition Everest’s actual waits averaged just 39% of the posted wait.

Animal Kingdom wait times for Saturday, January 9, 2021
DINOSAUR
Average Posted Wait
43
7-Day Rank
#5
30-Day Rank
#16
365-Day Rank
#80
Expedition Everest – Legend of the Forbidden Mountain
Average Posted Wait
33
Actual Waits Were
39%
7-Day Rank
#3
30-Day Rank
#13
365-Day Rank
#119
Kilimanjaro Safaris
Average Posted Wait
27
Actual Waits Were
48%
7-Day Rank
#3
30-Day Rank
#18
365-Day Rank
#106
It’s Tough to Be a Bug!
Average Posted Wait
19
7-Day Rank
#4
30-Day Rank
#22
365-Day Rank
#49
TriceraTop Spin
Average Posted Wait
5
7-Day Rank
#1
30-Day Rank
#11
365-Day Rank
#102
Na’vi River Journey
Average Posted Wait
62
Actual Waits Were
87%
7-Day Rank
#3
30-Day Rank
#14
365-Day Rank
#81
Avatar Flight of Passage
Average Posted Wait
58
Actual Waits Were
82%
7-Day Rank
#4
30-Day Rank
#22
365-Day Rank
#127

Hollywood Studios Wait Times

Mickey & Minnie’s Runaway Railway had an average wait time today of 45 minutes. Its 7-day average is 53 minutes, so today ranks #5 for this week. Its 30-day average is 47 minutes, so today ranks #16 for the past month. Its 365-day average is 65 minutes, so today ranks #164 for the past year. We received 7 actual wait times today, and the actual wait averaged 81% of the posted wait time.

Hollywood Studios wait times for Saturday, January 9, 2021

Rise of the Resistance had a pretty good day of operations, with only its usual afternoon pause in calling boarding groups.  This one went from around 2:30 p.m. until 3:15 p.m., at boarding group 100.
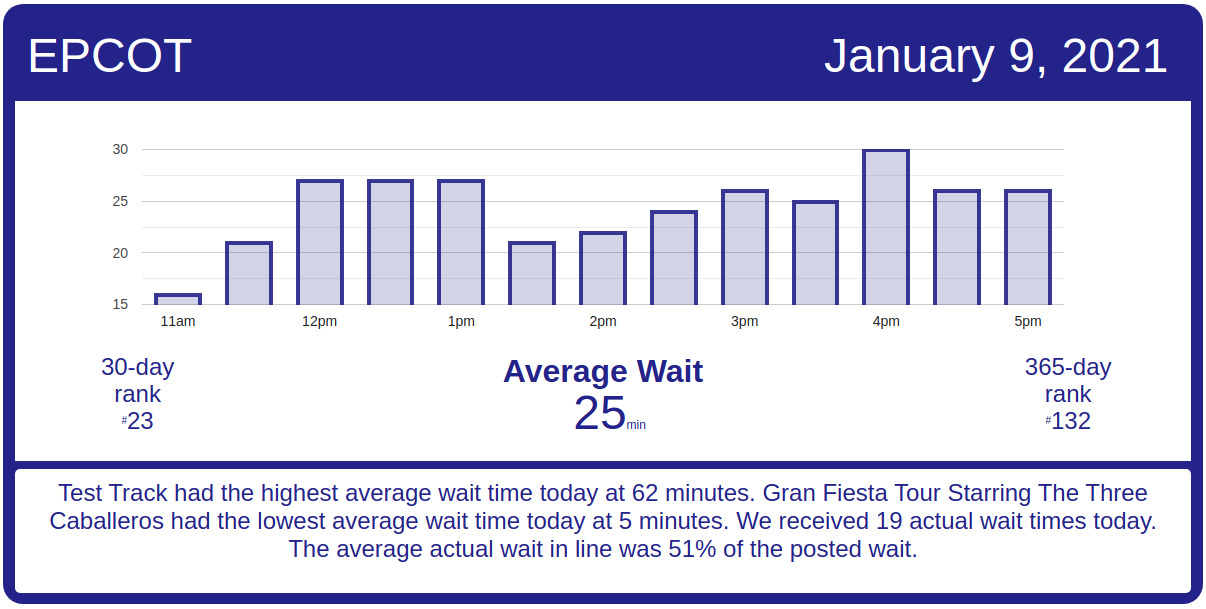
Rise of the Resistance boarding groups for Saturday, January 9, 2021
Muppet*Vision 3D
Average Posted Wait
24
7-Day Rank
#6
30-Day Rank
#29
365-Day Rank
#35
Rock ‘n’ Roller Coaster Starring Aerosmith
Average Posted Wait
39
Actual Waits Were
63%
7-Day Rank
#5
30-Day Rank
#22
365-Day Rank
#172
Star Tours: The Adventures Continue
Average Posted Wait
35
7-Day Rank
#6
30-Day Rank
#21
365-Day Rank
#51
The Twilight Zone Tower of Terror
Average Posted Wait
57
Actual Waits Were
81%
7-Day Rank
#6
30-Day Rank
#25
365-Day Rank
#92
Toy Story Mania!
Average Posted Wait
27
Actual Waits Were
55%
7-Day Rank
#5
30-Day Rank
#24
365-Day Rank
#138
Slinky Dog Dash
Average Posted Wait
55
Actual Waits Were
60%
7-Day Rank
#6
30-Day Rank
#23
365-Day Rank
#170
Alien Swirling Saucers
Average Posted Wait
21
7-Day Rank
#6
30-Day Rank
#29
365-Day Rank
#175
Mickey & Minnie’s Runaway Railway
Average Posted Wait
45
Actual Waits Were
81%
7-Day Rank
#5
30-Day Rank
#16
365-Day Rank
#164
Millennium Falcon: Smugglers Run
Average Posted Wait
60
7-Day Rank
#5
30-Day Rank
#24
365-Day Rank
#122

EPCOT Wait Times

Soarin’ had an average wait time today of 38 minutes. Its 7-day average is 34 minutes, so today ranks #1 for this week. Its 30-day average is 48 minutes, so today ranks #20 for the past month. Its 365-day average is 37 minutes, so today ranks #104 for the past year. We received 6 actual wait times today, and the actual wait averaged 57% of the posted wait time.

EPCOT wait times for Saturday, January 9, 2021
Gran Fiesta Tour Starring The Three Caballeros
Average Posted Wait
5
7-Day Rank
#6
30-Day Rank
#30
365-Day Rank
#225
Journey Into Imagination With Figment
Average Posted Wait
10
7-Day Rank
#3
30-Day Rank
#27
365-Day Rank
#157
Living with the Land
Average Posted Wait
14
Actual Waits Were
13%
7-Day Rank
#1
30-Day Rank
#8
365-Day Rank
#85
Mission: SPACE Orange
Average Posted Wait
33
7-Day Rank
#6
30-Day Rank
#25
365-Day Rank
#74
Soarin’
Average Posted Wait
38
Actual Waits Were
57%
7-Day Rank
#1
30-Day Rank
#20
365-Day Rank
#104
Spaceship Earth
Average Posted Wait
19
7-Day Rank
#2
30-Day Rank
#20
365-Day Rank
#122
Test Track
Average Posted Wait
62
7-Day Rank
#2
30-Day Rank
#21
365-Day Rank
#78
The Seas with Nemo & Friends
Average Posted Wait
10
7-Day Rank
#5
30-Day Rank
#20
365-Day Rank
#147
Frozen Ever After
Average Posted Wait
33
7-Day Rank
#1
30-Day Rank
#20
365-Day Rank
#192

The post Moderate Crowds All Over – Disney World Wait Times for Saturday, January 9, 2021 appeared first on TouringPlans.com Blog.