Moderate Crowds Return – Disney World Wait Times for Saturday, January 30, 2021

Moderate-size crowds returned to Walt Disney World today, with most parks’ posted wait times averaging somewhere near the middle of where they’ve been over the past month.  That’s still low compared to other times of the year (and to pre-pandemic times), even if it’s busier than the near-year lows they’ve been over the past few days.

We counted 487 of 500 guests (97%) wearing masks in the Magic Kingdom in accordance with Disney’s guidelines.  And we got 122 actual wait times from our fabulous Lines app community!  Let’s do the rest of the numbers.

Magic Kingdom Wait Times

Space Mountain had an average wait time today of 47 minutes. Its 7-day average is 26 minutes, so today ranks #1 for this week. Its 30-day average is 41 minutes, so today ranks #12 for the past month. We received 6 actual wait times today, and the actual wait averaged 62% of the posted wait time.

Magic Kingdom wait times for Saturday, January 30, 2021
Astro Orbiter
Average Posted Wait
47
7-Day Rank
#1
30-Day Rank
#1
365-Day Rank
#6
Big Thunder Mountain Railroad
Average Posted Wait
50
Actual Waits Were
64%
7-Day Rank
#1
30-Day Rank
#12
365-Day Rank
#96
Buzz Lightyear’s Space Ranger Spin
Average Posted Wait
40
7-Day Rank
#1
30-Day Rank
#7
365-Day Rank
#75
Dumbo the Flying Elephant
Average Posted Wait
23
7-Day Rank
#1
30-Day Rank
#1
365-Day Rank
#51
“it’s a small world”
Average Posted Wait
42
7-Day Rank
#1
30-Day Rank
#6
365-Day Rank
#64
Jungle Cruise
Average Posted Wait
50
Actual Waits Were
110%
7-Day Rank
#1
30-Day Rank
#2
365-Day Rank
#55
Mad Tea Party
Average Posted Wait
19
7-Day Rank
#1
30-Day Rank
#6
365-Day Rank
#47
Mickey’s PhilharMagic
Average Posted Wait
29
7-Day Rank
#1
30-Day Rank
#8
365-Day Rank
#29
Peter Pan’s Flight
Average Posted Wait
39
7-Day Rank
#1
30-Day Rank
#8
365-Day Rank
#91
Pirates of the Caribbean
Average Posted Wait
50
7-Day Rank
#1
30-Day Rank
#9
365-Day Rank
#78
Space Mountain
Average Posted Wait
47
Actual Waits Were
62%
7-Day Rank
#1
30-Day Rank
#12
365-Day Rank
#99
Splash Mountain
Average Posted Wait
46
Actual Waits Were
85%
7-Day Rank
#1
30-Day Rank
#12
365-Day Rank
#120
The Barnstormer
Average Posted Wait
32
7-Day Rank
#1
30-Day Rank
#4
365-Day Rank
#48
The Haunted Mansion
Average Posted Wait
32
Actual Waits Were
87%
7-Day Rank
#1
30-Day Rank
#4
365-Day Rank
#108
The Magic Carpets of Aladdin
Average Posted Wait
18
7-Day Rank
#1
30-Day Rank
#5
365-Day Rank
#61
The Many Adventures of Winnie the Pooh
Average Posted Wait
27
7-Day Rank
#1
30-Day Rank
#9
365-Day Rank
#102
Tomorrowland Speedway
Average Posted Wait
28
7-Day Rank
#1
30-Day Rank
#3
365-Day Rank
#49
Seven Dwarfs Mine Train
Average Posted Wait
68
Actual Waits Were
94%
7-Day Rank
#1
30-Day Rank
#11
365-Day Rank
#99
Under the Sea ~ Journey of the Little Mermaid
Average Posted Wait
28
7-Day Rank
#1
30-Day Rank
#6
365-Day Rank
#71

Animal Kingdom Wait Times

Expedition Everest had an average wait time today of 26 minutes. Its 7-day average is 13 minutes, so today ranks #1 for this week. Its 30-day average is 21 minutes, so today ranks #9 for the past month.  We received 7 actual wait times today, and the actual wait averaged 62% of the posted wait time.

Animal Kingdom wait times for Saturday, January 30, 2021
DINOSAUR
Average Posted Wait
44
7-Day Rank
#1
30-Day Rank
#12
365-Day Rank
#71
Expedition Everest – Legend of the Forbidden Mountain
Average Posted Wait
26
Actual Waits Were
62%
7-Day Rank
#1
30-Day Rank
#9
365-Day Rank
#128
Kilimanjaro Safaris
Average Posted Wait
27
Actual Waits Were
55%
7-Day Rank
#1
30-Day Rank
#7
365-Day Rank
#87
It’s Tough to Be a Bug!
Average Posted Wait
23
7-Day Rank
#1
30-Day Rank
#4
365-Day Rank
#29
TriceraTop Spin
Average Posted Wait
5
7-Day Rank
#1
30-Day Rank
#4
365-Day Rank
#87
Na’vi River Journey
Average Posted Wait
63
7-Day Rank
#1
30-Day Rank
#8
365-Day Rank
#64
Avatar Flight of Passage
Average Posted Wait
50
Actual Waits Were
84%
7-Day Rank
#1
30-Day Rank
#10
365-Day Rank
#127

Hollywood Studios Wait Times

Rock ‘n’ Roller Coaster Starring Culture Club had an average wait time today of 38 minutes. Its 7-day average is 29 minutes, so today ranks #1 for this week. Its 30-day average is 38 minutes, so today ranks #12 for the past month.

Hollywood Studios wait times for Saturday, January 30, 2021

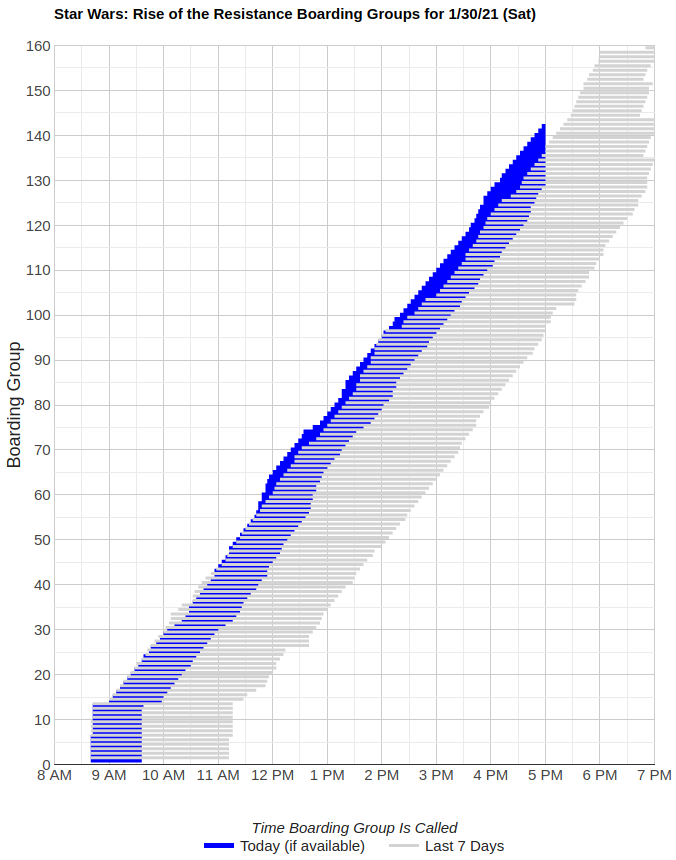
Rise of the Resistance is having an excellent day of operations!  Rise started calling boarding groups around 8:45 a.m. and hasn’t stopped all day.  As I write this they’re up above boarding group 140, and should make it to 160 or beyond before the park closes.

Rise of the Resistance boarding groups for Saturday, January 30, 2021
Muppet*Vision 3D
Average Posted Wait
25
7-Day Rank
#4
30-Day Rank
#20
365-Day Rank
#47
Rock ‘n’ Roller Coaster Starring Aerosmith
Average Posted Wait
38
7-Day Rank
#1
30-Day Rank
#12
365-Day Rank
#164
Star Tours: The Adventures Continue
Average Posted Wait
34
7-Day Rank
#1
30-Day Rank
#13
365-Day Rank
#52
The Twilight Zone Tower of Terror
Average Posted Wait
50
7-Day Rank
#1
30-Day Rank
#16
365-Day Rank
#113
Toy Story Mania!
Average Posted Wait
27
Actual Waits Were
57%
7-Day Rank
#2
30-Day Rank
#12
365-Day Rank
#122
Slinky Dog Dash
Average Posted Wait
54
Actual Waits Were
78%
7-Day Rank
#1
30-Day Rank
#16
365-Day Rank
#158
Alien Swirling Saucers
Average Posted Wait
27
Actual Waits Were
53%
7-Day Rank
#1
30-Day Rank
#7
365-Day Rank
#95
Mickey & Minnie’s Runaway Railway
Average Posted Wait
46
7-Day Rank
#1
30-Day Rank
#8
365-Day Rank
#158
Millennium Falcon: Smugglers Run
Average Posted Wait
52
7-Day Rank
#1
30-Day Rank
#12
365-Day Rank
#141

EPCOT Wait Times

Frozen Ever After had an average wait time today of 33 minutes. Its 7-day average is 20 minutes, so today ranks #1 for this week. Its 30-day average is 26 minutes, so today ranks #7 for the past month. We received 5 actual wait times today, and the actual wait averaged 71% of the posted wait time.

EPCOT wait times for Saturday, January 30, 2021
Gran Fiesta Tour Starring The Three Caballeros
Average Posted Wait
5
7-Day Rank
#5
30-Day Rank
#24
365-Day Rank
#229
Journey Into Imagination With Figment
Average Posted Wait
17
7-Day Rank
#1
30-Day Rank
#8
365-Day Rank
#81
Living with the Land
Average Posted Wait
14
7-Day Rank
#1
30-Day Rank
#2
365-Day Rank
#76
Mission: SPACE Orange
Average Posted Wait
26
7-Day Rank
#1
30-Day Rank
#15
365-Day Rank
#107
Soarin’
Average Posted Wait
36
Actual Waits Were
76%
7-Day Rank
#1
30-Day Rank
#7
365-Day Rank
#104
Spaceship Earth
Average Posted Wait
22
Actual Waits Were
57%
7-Day Rank
#1
30-Day Rank
#7
365-Day Rank
#86
Test Track
Average Posted Wait
55
7-Day Rank
#1
30-Day Rank
#14
365-Day Rank
#100
The Seas with Nemo & Friends
Average Posted Wait
12
7-Day Rank
#1EP Something
30-Day Rank
#5
365-Day Rank
#93
Frozen Ever After
Average Posted Wait
33
Actual Waits Were
71%
7-Day Rank
#1
30-Day Rank
#7
365-Day Rank
#175

The post Moderate Crowds Return – Disney World Wait Times for Saturday, January 30, 2021 appeared first on TouringPlans.com Blog.