So Slow! Disney World Wait Times for Monday, January 25, 2021

It was another day of low crowds at Walt Disney World today.  The average posted wait time at EPCOT was 12 – yes 12 – minutes.  Most EPCOT attractions’ posted wait times were near their lows for the year.  In fact, every Disney World park’s wait times for today were near their monthly lows, so it was a great day to be in the parks.  Also, Rise of the Resistance is having a great day of operations.

We got 104 actual wait times today from our fabulous Lines community. And we counted 491 of 500 guests (98%) at EPCOT today wearing masks according to Disney’s guidelines.  Let’s do the rest of the numbers!

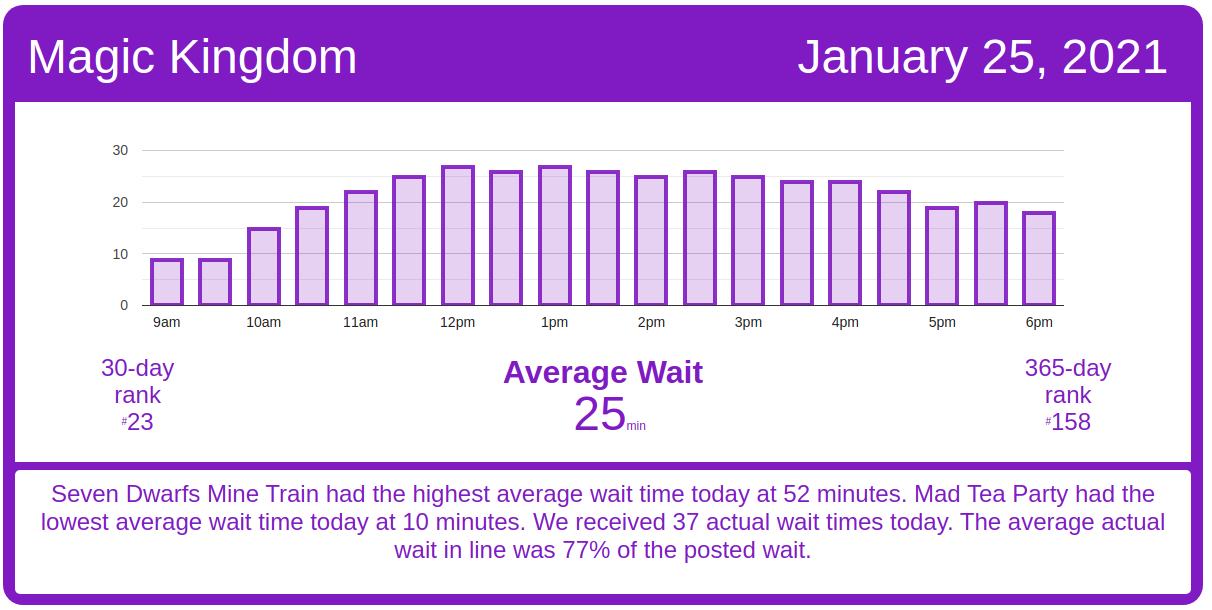
Magic Kingdom Wait Times

Jungle Cruise had an average wait time today of 32 minutes. Its 7-day average is 30 minutes, so today ranks #2 for this week. Its 30-day average is 40 minutes, so today ranks #22 for the past month.

Magic Kingdom wait times for Monday, January 25, 2021
Astro Orbiter
Average Posted Wait
31
7-Day Rank
#4
30-Day Rank
#25
365-Day Rank
#130
Big Thunder Mountain Railroad
Average Posted Wait
40
7-Day Rank
#3
30-Day Rank
#23
365-Day Rank
#159
Buzz Lightyear’s Space Ranger Spin
Average Posted Wait
30
7-Day Rank
#2
30-Day Rank
#19
365-Day Rank
#132
Dumbo the Flying Elephant
Average Posted Wait
11
7-Day Rank
#1
30-Day Rank
#14
365-Day Rank
#125
“it’s a small world”
Average Posted Wait
31
7-Day Rank
#4
30-Day Rank
#25
365-Day Rank
#159
Jungle Cruise
Average Posted Wait
32
7-Day Rank
#2
30-Day Rank
#22
365-Day Rank
#182
Mad Tea Party
Average Posted Wait
10
7-Day Rank
#3
30-Day Rank
#23
365-Day Rank
#169
Mickey’s PhilharMagic
Average Posted Wait
23
7-Day Rank
#1
30-Day Rank
#18
365-Day Rank
#40
Peter Pan’s Flight
Average Posted Wait
26
7-Day Rank
#2
30-Day Rank
#23
365-Day Rank
#178
Pirates of the Caribbean
Average Posted Wait
35
7-Day Rank
#4
30-Day Rank
#25
365-Day Rank
#183
Space Mountain
Average Posted Wait
24
7-Day Rank
#4
30-Day Rank
#25
365-Day Rank
#170
Splash Mountain
Average Posted Wait
43
Actual Waits Were
57%
7-Day Rank
#1
30-Day Rank
#19
365-Day Rank
#125
The Barnstormer
Average Posted Wait
15
7-Day Rank
#4
30-Day Rank
#24
365-Day Rank
#148
The Haunted Mansion
Average Posted Wait
18
Actual Waits Were
47%
7-Day Rank
#1
30-Day Rank
#16
365-Day Rank
#190
The Magic Carpets of Aladdin
Average Posted Wait
14
7-Day Rank
#2
30-Day Rank
#17
365-Day Rank
#121
The Many Adventures of Winnie the Pooh
Average Posted Wait
19
7-Day Rank
#3
30-Day Rank
#22
365-Day Rank
#177
Tomorrowland Speedway
Average Posted Wait
10
7-Day Rank
#4
30-Day Rank
#26
365-Day Rank
#199
Seven Dwarfs Mine Train
Average Posted Wait
52
7-Day Rank
#4
30-Day Rank
#25
365-Day Rank
#155
Under the Sea ~ Journey of the Little Mermaid
Average Posted Wait
17
7-Day Rank
#2
30-Day Rank
#18
365-Day Rank
#163

Animal Kingdom Wait Times

Expedition Everest – Legend of the Forbidden Mountain had an average wait time today of 13 minutes. Its 7-day average is 14 minutes, so today ranks #2 for this week. Its 30-day average is 27 minutes, so today ranks #21 for the past month. Its 365-day average is 36 minutes, so today ranks #219 for the past year. We received 6 actual wait times today, and the actual wait averaged 55% of the posted wait time.

Animal Kingdom wait times for Monday, January 25, 2021
DINOSAUR
Average Posted Wait
17
7-Day Rank
#5
30-Day Rank
#28
365-Day Rank
#174
Expedition Everest – Legend of the Forbidden Mountain
Average Posted Wait
13
Actual Waits Were
55%
7-Day Rank
#2
30-Day Rank
#21
365-Day Rank
#219
Kilimanjaro Safaris
Average Posted Wait
10
Actual Waits Were
77%
7-Day Rank
#3
30-Day Rank
#22
365-Day Rank
#222
It’s Tough to Be a Bug!
Average Posted Wait
10
7-Day Rank
#5
30-Day Rank
#26
365-Day Rank
#164
TriceraTop Spin
Average Posted Wait
5
7-Day Rank
#1
30-Day Rank
#8
365-Day Rank
#92
Na’vi River Journey
Average Posted Wait
36
Actual Waits Were
85%
7-Day Rank
#3
30-Day Rank
#25
365-Day Rank
#178
Avatar Flight of Passage
Average Posted Wait
24
Actual Waits Were
73%
7-Day Rank
#2
30-Day Rank
#21
365-Day Rank
#191

Hollywood Studios Wait Times

Millennium Falcon: Smugglers Run had an average wait time today of 36 minutes. Its 7-day average is 39 minutes, so today ranks #3 for this week. Its 30-day average is 58 minutes, so today ranks #25 for the past month. Its 365-day average is 57 minutes, so today ranks #215 for the past year. We received 4 actual wait times today, and the actual wait averaged 90% of the posted wait time.

I’m not sure why Rise of the Resistance was showing a posted wait time today.  That’s just a glitch.

Hollywood Studios wait times for Monday, January 25, 2021

Rise of the Resistance has had an excellent day of operations today, calling just under 160 boarding groups as I write this.  It’s a good bounce-back from the difficulties the attraction had over the weekend.

Rise of the Resistance boarding groups for Monday, January 25, 2021
Muppet*Vision 3D
Average Posted Wait
26
7-Day Rank
#1
30-Day Rank
#19
365-Day Rank
#39
Rock ‘n’ Roller Coaster Starring Aerosmith
Average Posted Wait
23
Actual Waits Were
53%
7-Day Rank
#4
30-Day Rank
#26
365-Day Rank
#228
Star Tours: The Adventures Continue
Average Posted Wait
22
7-Day Rank
#4
30-Day Rank
#27
365-Day Rank
#164
The Twilight Zone Tower of Terror
Average Posted Wait
40
Actual Waits Were
76%
7-Day Rank
#5
30-Day Rank
#28
365-Day Rank
#186
Toy Story Mania!
Average Posted Wait
18
Actual Waits Were
44%
7-Day Rank
#5
30-Day Rank
#28
365-Day Rank
#197
Slinky Dog Dash
Average Posted Wait
47
Actual Waits Were
50%
7-Day Rank
#4
30-Day Rank
#25
365-Day Rank
#182
Alien Swirling Saucers
Average Posted Wait
21
7-Day Rank
#4
30-Day Rank
#25
365-Day Rank
#171
Mickey & Minnie’s Runaway Railway
Average Posted Wait
38
Actual Waits Were
74%
7-Day Rank
#2
30-Day Rank
#23
365-Day Rank
#196
Millennium Falcon: Smugglers Run
Average Posted Wait
36
Actual Waits Were
90%
7-Day Rank
#3
30-Day Rank
#25
365-Day Rank
#215

EPCOT Wait Times

Frozen Ever After had an average wait time today of 15 minutes. Its 7-day average is 21 minutes, so today ranks #5 for this week. Its 30-day average is 33 minutes, so today ranks #29 for the past month. Its 365-day average is 53 minutes, so today ranks #239 for the past year.

EPCOT wait times for Monday, January 25, 2021
Gran Fiesta Tour Starring The Three Caballeros
Average Posted Wait
7
7-Day Rank
#1
30-Day Rank
#16
365-Day Rank
#153
Journey Into Imagination With Figment
Average Posted Wait
6
7-Day Rank
#4
30-Day Rank
#23
365-Day Rank
#218
Living with the Land
Average Posted Wait
6
7-Day Rank
#5
30-Day Rank
#28
365-Day Rank
#242
Mission: SPACE Orange
Average Posted Wait
10
7-Day Rank
#6
30-Day Rank
#29
365-Day Rank
#243
Soarin’
Average Posted Wait
15
7-Day Rank
#5
30-Day Rank
#28
365-Day Rank
#206
Spaceship Earth
Average Posted Wait
13
7-Day Rank
#2
30-Day Rank
#22
365-Day Rank
#155
Test Track
Average Posted Wait
36
7-Day Rank
#6
30-Day Rank
#31
365-Day Rank
#176
The Seas with Nemo & Friends
Average Posted Wait
6
7-Day Rank
#5
30-Day Rank
#28
365-Day Rank
#233
Frozen Ever After
Average Posted Wait
15
7-Day Rank
#5
30-Day Rank
#29
365-Day Rank
#239

The post So Slow! Disney World Wait Times for Monday, January 25, 2021 appeared first on TouringPlans.com Blog.