Low to Moderate Crowds – Disney World Wait Times for Wednesday, February 3, 2021

Crowds were relatively larger today at EPCOT and Hollywood Studios, with those parks’ wait times about average with those from the past month.  Things were slower at Magic Kingdom and Animal Kingdom, where those wait times were closer to their month-long lows. We got 139 actual wait times from our fabulous Lines community, and we counted 489 of 500 guests (98%) at Disney Springs wearing masks according to Disney’s guidelines.  Let’s do the rest of the numbers!

Magic Kingdom Wait Times

Peter Pan’s Flight had an average wait time today of 20 minutes. Its 7-day average is 29 minutes, so today ranks #6 for this week. Its 30-day average is 30 minutes, so today ranks #26 for the past month. Its 365-day average is 39 minutes, so today ranks #220 for the past year. We received 5 actual wait times today, and the actual wait averaged 99% of the posted wait time.

Magic Kingdom wait times for Wednesday, February 3, 2021
Astro Orbiter
Average Posted Wait
30
7-Day Rank
#3
30-Day Rank
#22
365-Day Rank
#138
Big Thunder Mountain Railroad
Average Posted Wait
32
Actual Waits Were
52%
7-Day Rank
#5
30-Day Rank
#25
365-Day Rank
#191
Buzz Lightyear’s Space Ranger Spin
Average Posted Wait
17
Actual Waits Were
59%
7-Day Rank
#6
30-Day Rank
#27
365-Day Rank
#191
Country Bear Jamboree
Average Posted Wait
10
7-Day Rank
#1
30-Day Rank
#1
365-Day Rank
#1
Dumbo the Flying Elephant
Average Posted Wait
7
7-Day Rank
#6
30-Day Rank
#23
365-Day Rank
#186
“it’s a small world”
Average Posted Wait
28
7-Day Rank
#6
30-Day Rank
#25
365-Day Rank
#175
Jungle Cruise
Average Posted Wait
34
7-Day Rank
#6
30-Day Rank
#19
365-Day Rank
#169
Mad Tea Party
Average Posted Wait
6
7-Day Rank
#6
30-Day Rank
#24
365-Day Rank
#236
Mickey’s PhilharMagic
Average Posted Wait
19
7-Day Rank
#6
30-Day Rank
#21
365-Day Rank
#101
Peter Pan’s Flight
Average Posted Wait
20
Actual Waits Were
99%
7-Day Rank
#6
30-Day Rank
#26
365-Day Rank
#220
Space Mountain
Average Posted Wait
15
Actual Waits Were
45%
7-Day Rank
#6
30-Day Rank
#27
365-Day Rank
#206
Splash Mountain
Average Posted Wait
29
7-Day Rank
#3
30-Day Rank
#22
365-Day Rank
#185
The Barnstormer
Average Posted Wait
14
7-Day Rank
#5
30-Day Rank
#22
365-Day Rank
#149
The Haunted Mansion
Average Posted Wait
10
Actual Waits Were
51%
7-Day Rank
#6
30-Day Rank
#26
365-Day Rank
#237
The Magic Carpets of Aladdin
Average Posted Wait
12
7-Day Rank
#3
30-Day Rank
#19
365-Day Rank
#157
The Many Adventures of Winnie the Pooh
Average Posted Wait
18
7-Day Rank
#6
30-Day Rank
#24
365-Day Rank
#191
Tomorrowland Speedway
Average Posted Wait
6
7-Day Rank
#6
30-Day Rank
#29
365-Day Rank
#248
Seven Dwarfs Mine Train
Average Posted Wait
49
7-Day Rank
#4
30-Day Rank
#23
365-Day Rank
#162
Under the Sea ~ Journey of the Little Mermaid
Average Posted Wait
8
7-Day Rank
#5
30-Day Rank
#26
365-Day Rank
#214

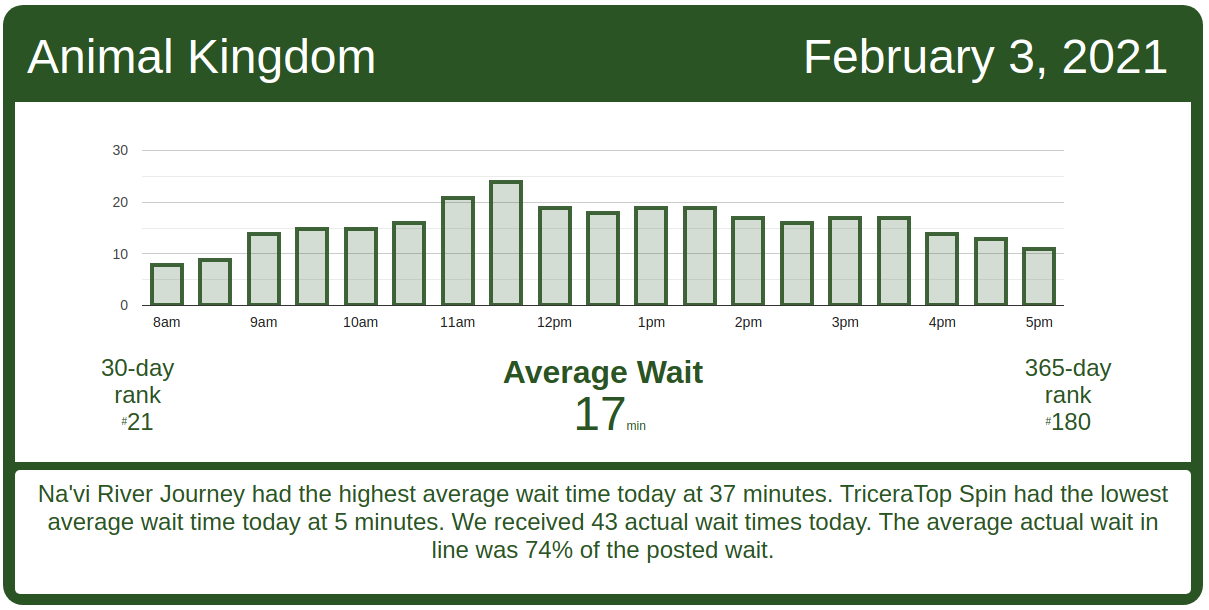
Animal Kingdom Wait Times

Na’vi River Journey had an average wait time today of 37 minutes. Its 7-day average is 45 minutes, so today ranks #4 for this week. Its 30-day average is 46 minutes, so today ranks #20 for the past month. Its 365-day average is 48 minutes, so today ranks #168 for the past year. We received 7 actual wait times today, and the actual wait averaged 99% of the posted wait time.

Animal Kingdom wait times for Wednesday, February 3, 2021
DINOSAUR
Average Posted Wait
20
7-Day Rank
#4
30-Day Rank
#23
365-Day Rank
#162
Expedition Everest – Legend of the Forbidden Mountain
Average Posted Wait
16
Actual Waits Were
33%
7-Day Rank
#2
30-Day Rank
#14
365-Day Rank
#196
Kilimanjaro Safaris
Average Posted Wait
16
Actual Waits Were
86%
7-Day Rank
#2
30-Day Rank
#12
365-Day Rank
#162
It’s Tough to Be a Bug!
Average Posted Wait
10
7-Day Rank
#4
30-Day Rank
#22
365-Day Rank
#164
TriceraTop Spin
Average Posted Wait
5
7-Day Rank
#1
30-Day Rank
#2
365-Day Rank
#82
Na’vi River Journey
Average Posted Wait
37
Actual Waits Were
99%
7-Day Rank
#4
30-Day Rank
#20
365-Day Rank
#168
Avatar Flight of Passage
Average Posted Wait
21
Actual Waits Were
77%
7-Day Rank
#4
30-Day Rank
#20
365-Day Rank
#194

Hollywood Studios Wait Times

It looks like there were operational issues at Tower of Terror today – perhaps one of its drop shafts wasn’t working.  It’s unlikely that Tower would see an average wait time of 81 minutes on a Wednesday in early February otherwise.

Hollywood Studios wait times for Wednesday, February 3, 2021

It’s been another solid day of operations at Rise of the Resistance today. Rise started calling boarding groups around 8:45 a.m. and has continued without interruption since then.  As I write this, Rise of the Resistance is up to boarding group 132.  The rate at which ROTR is calling boarding groups is about the middle of its pace for the past week, too, so everything looks good for Rise to call between 150 and 160+ boarding groups for the day.

Rise of the Resistance boarding groups for Wednesday, February 3, 2021
Muppet*Vision 3D
Average Posted Wait
29
7-Day Rank
#1
30-Day Rank
#3
365-Day Rank
#23
Rock ‘n’ Roller Coaster Starring Aerosmith
Average Posted Wait
34
Actual Waits Were
61%
7-Day Rank
#1
30-Day Rank
#15
365-Day Rank
#177
Star Tours: The Adventures Continue
Average Posted Wait
25
7-Day Rank
#4
30-Day Rank
#21
365-Day Rank
#133
The Twilight Zone Tower of Terror
Average Posted Wait
81
7-Day Rank
#1
30-Day Rank
#1
365-Day Rank
#25
Toy Story Mania!
Average Posted Wait
27
7-Day Rank
#1
30-Day Rank
#11
365-Day Rank
#126
Slinky Dog Dash
Average Posted Wait
45
Actual Waits Were
53%
7-Day Rank
#6
30-Day Rank
#26
365-Day Rank
#186
Alien Swirling Saucers
Average Posted Wait
24
Actual Waits Were
64%
7-Day Rank
#1
30-Day Rank
#12
365-Day Rank
#141
Mickey & Minnie’s Runaway Railway
Average Posted Wait
38
7-Day Rank
#5
30-Day Rank
#22
365-Day Rank
#204
Millennium Falcon: Smugglers Run
Average Posted Wait
37
7-Day Rank
#5
30-Day Rank
#24
365-Day Rank
#209

EPCOT Wait Times

Frozen Ever After had an average wait time today of 19 minutes. Its 7-day average is 22 minutes, so today ranks #4 for this week. Its 30-day average is 24 minutes, so today ranks #22 for the past month. Its 365-day average is 51 minutes, so today ranks #232 for the past year. We received 4 actual wait times today, and the actual wait averaged 100% of the posted wait time.

EPCOT wait times for Wednesday, February 3, 2021
Gran Fiesta Tour Starring The Three Caballeros
Average Posted Wait
8
7-Day Rank
#1
30-Day Rank
#8
365-Day Rank
#142
Journey Into Imagination With Figment
Average Posted Wait
8
7-Day Rank
#3
30-Day Rank
#14
365-Day Rank
#168
Living with the Land
Average Posted Wait
5
7-Day Rank
#5
30-Day Rank
#28
365-Day Rank
#242
Mission: SPACE Orange
Average Posted Wait
18
7-Day Rank
#2
30-Day Rank
#18
365-Day Rank
#160
Soarin’
Average Posted Wait
29
7-Day Rank
#1
30-Day Rank
#9
365-Day Rank
#138
Spaceship Earth
Average Posted Wait
13
7-Day Rank
#3
30-Day Rank
#17
365-Day Rank
#147
Test Track
Average Posted Wait
45
Actual Waits Were
71%
7-Day Rank
#3
30-Day Rank
#21
365-Day Rank
#145
The Seas with Nemo & Friends
Average Posted Wait
5
7-Day Rank
#6
30-Day Rank
#29
365-Day Rank
#239
Mission: SPACE Green
Average Posted Wait
5
7-Day Rank
#6
30-Day Rank
#29
365-Day Rank
#246
Disney & Pixar Short Film Festival
Average Posted Wait
10
7-Day Rank
#1
30-Day Rank
#1
365-Day Rank
#1
Frozen Ever After
Average Posted Wait
19
Actual Waits Were
100%
7-Day Rank
#4
30-Day Rank
#22
365-Day Rank
#232

The post Low to Moderate Crowds – Disney World Wait Times for Wednesday, February 3, 2021 appeared first on TouringPlans.com Blog.