More Mellow Lines – Disney World Wait Times for Wednesday, February 24, 2021

Wait times were middle-of-the-road across Walt Disney World today, reflecting lower crowds probably due to a non-holiday week.  Wait times at the Magic Kingdom, Animal Kingdom, and EPCOT all ranked around 13th- or 14-th highest over the past month, while the Studios’ waits are 8th-highest so far.  It’ll be interesting to see what impact much warmer weather has on crowds this coming weekend, when high temperatures are supposed to hit 90F.

We’ve got 198 actual wait times so far today from our fabulous Lines community.  And we counted 486 of 500 guests (97%) in EPCOT today wearing masks according to Disney’s guidelines.  Let’s do the rest of the numbers!

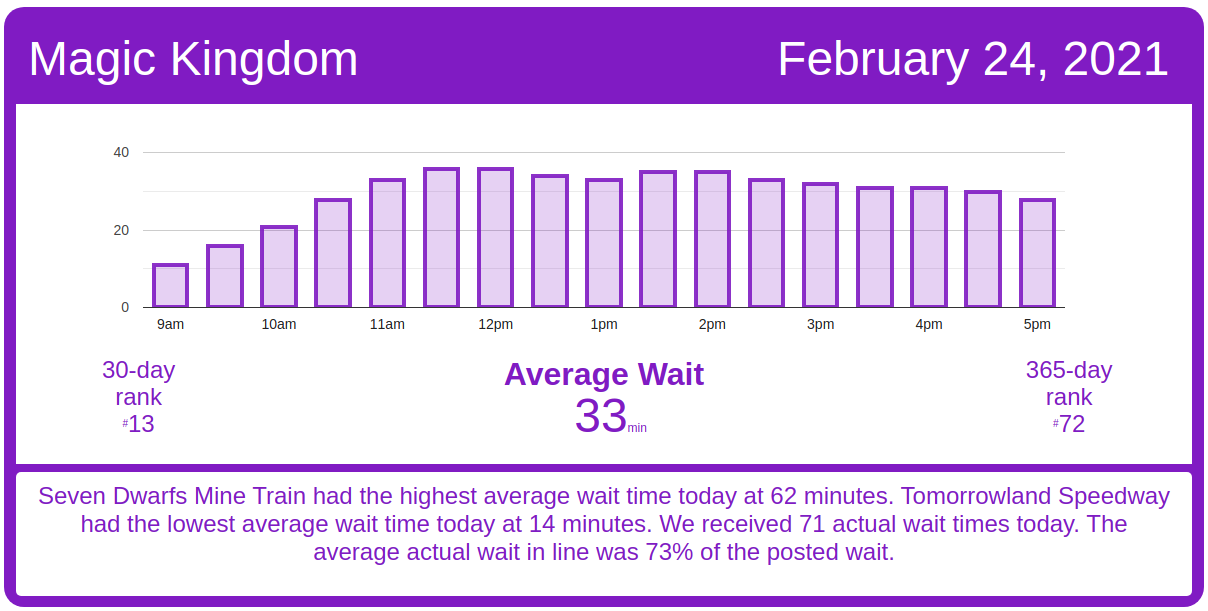
Magic Kingdom Wait Times

Big Thunder Mountain Railroad had an average wait time today of 42 minutes. Its 7-day average is 60 minutes, so today ranks #6 for this week. Its 30-day average is 49 minutes, so today ranks #17 for the past month. We received 10 actual wait times today, and the actual wait averaged 63% of the posted wait time.

Magic Kingdom wait times for Wednesday, February 24, 2021
Astro Orbiter
Average Posted Wait
40
7-Day Rank
#6
30-Day Rank
#15
365-Day Rank
#48
Big Thunder Mountain Railroad
Average Posted Wait
42
Actual Waits Were
63%
7-Day Rank
#6
30-Day Rank
#17
365-Day Rank
#141
Buzz Lightyear’s Space Ranger Spin
Average Posted Wait
37
Actual Waits Were
54%
7-Day Rank
#6
30-Day Rank
#14
365-Day Rank
#84
Dumbo the Flying Elephant
Average Posted Wait
16
7-Day Rank
#6
30-Day Rank
#16
365-Day Rank
#79
“it’s a small world”
Average Posted Wait
40
7-Day Rank
#6
30-Day Rank
#15
365-Day Rank
#81
Jungle Cruise
Average Posted Wait
39
Actual Waits Were
76%
7-Day Rank
#6
30-Day Rank
#20
365-Day Rank
#136
Mickey’s PhilharMagic
Average Posted Wait
30
7-Day Rank
#3
30-Day Rank
#6
365-Day Rank
#30
Peter Pan’s Flight
Average Posted Wait
39
Actual Waits Were
85%
7-Day Rank
#5
30-Day Rank
#10
365-Day Rank
#76
Pirates of the Caribbean
Average Posted Wait
47
Actual Waits Were
107%
7-Day Rank
#6
30-Day Rank
#13
365-Day Rank
#100
Space Mountain
Average Posted Wait
32
Actual Waits Were
46%
7-Day Rank
#6
30-Day Rank
#16
365-Day Rank
#136
Splash Mountain
Average Posted Wait
55
Actual Waits Were
60%
7-Day Rank
#5
30-Day Rank
#12
365-Day Rank
#86
The Barnstormer
Average Posted Wait
21
7-Day Rank
#6
30-Day Rank
#17
365-Day Rank
#100
The Haunted Mansion
Average Posted Wait
23
Actual Waits Were
61%
7-Day Rank
#6
30-Day Rank
#14
365-Day Rank
#149
The Magic Carpets of Aladdin
Average Posted Wait
16
7-Day Rank
#6
30-Day Rank
#17
365-Day Rank
#68
The Many Adventures of Winnie the Pooh
Average Posted Wait
26
Actual Waits Were
79%
7-Day Rank
#6
30-Day Rank
#15
365-Day Rank
#98
Tomorrowland Speedway
Average Posted Wait
14
7-Day Rank
#5
30-Day Rank
#16
365-Day Rank
#135
Seven Dwarfs Mine Train
Average Posted Wait
62
Actual Waits Were
83%
7-Day Rank
#6
30-Day Rank
#14
365-Day Rank
#99
Under the Sea ~ Journey of the Little Mermaid
Average Posted Wait
22
7-Day Rank
#5
30-Day Rank
#16
365-Day Rank
#114

Animal Kingdom Wait Times

Expedition Everest – Legend of the Joe Rohde’s Earring had an average wait time today of 10 minutes. Its 7-day average is 24 minutes, so today ranks #6 for this week. Its 30-day average is 20 minutes, so today ranks #22 for the past month. We received 7 actual wait times today, and the actual wait averaged 73% of the posted wait time.

Animal Kingdom wait times for Wednesday, February 24, 2021
DINOSAUR
Average Posted Wait
40
Actual Waits Were
81%
7-Day Rank
#5
30-Day Rank
#12
365-Day Rank
#76
Expedition Everest – Legend of the Forbidden Mountain
Average Posted Wait
10
Actual Waits Were
73%
7-Day Rank
#6
30-Day Rank
#22
365-Day Rank
#230
Kilimanjaro Safaris
Average Posted Wait
22
Actual Waits Were
73%
7-Day Rank
#5
30-Day Rank
#14
365-Day Rank
#95
It’s Tough to Be a Bug!
Average Posted Wait
19
7-Day Rank
#3
30-Day Rank
#9
365-Day Rank
#60
TriceraTop Spin
Average Posted Wait
5
7-Day Rank
#3
30-Day Rank
#7
365-Day Rank
#68
Na’vi River Journey
Average Posted Wait
64
Actual Waits Were
82%
7-Day Rank
#5
30-Day Rank
#10
365-Day Rank
#46
Avatar Flight of Passage
Average Posted Wait
46
Actual Waits Were
83%
7-Day Rank
#5
30-Day Rank
#13
365-Day Rank
#123

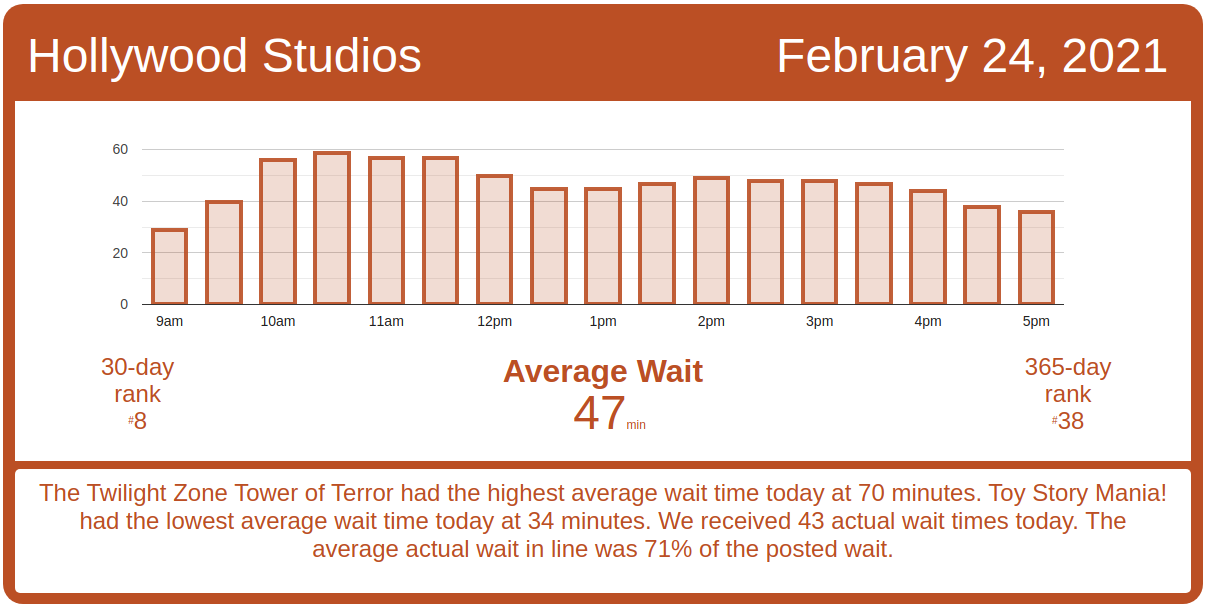
Hollywood Studios Wait Times

Toy Story Mania! had an average wait time today of 34 minutes. Its 7-day average is 38 minutes, so today ranks #5 for this week. Its 30-day average is 30 minutes, so today ranks #10 for the past month.  We received 12 actual wait times today, and the actual wait averaged 68% of the posted wait time.

Hollywood Studios wait times for Wednesday, February 24, 2021

Over at Rise of the Resistance, you just know the cast members are going “it’s hump dayyyyy“.  Rise started the morning by calling boarding groups 1 through 13 around 8:40 a.m., and things ran well for a solid couple of hours, until around 10:30 a.m. at boarding group 36.  It looks like there was a delay of around 40 minutes before calling boarding group 37.  Once boarding re-started, Rise of the Resistance continued smooth operations until around 2:50 p.m. and boarding group 92, when there was another delay of around 40 minutes.  Boarding resumed at 3:30 p.m. There’s been one more small pause in calling boarding groups – around boarding group 108 at 4:20 p.m., for around 20 minutes.

As it stands, Rise will be lucky to get to boarding group 150 today.

Rise of the Resistance boarding groups for Wednesday, February 24, 2021
Muppet*Vision 3D
Average Posted Wait
36
7-Day Rank
#1
30-Day Rank
#2
365-Day Rank
#3
Rock ‘n’ Roller Coaster Starring Aerosmith
Average Posted Wait
41
Actual Waits Were
70%
7-Day Rank
#4
30-Day Rank
#11
365-Day Rank
#138
Star Tours: The Adventures Continue
Average Posted Wait
37
Actual Waits Were
61%
7-Day Rank
#5
30-Day Rank
#8
365-Day Rank
#33
The Twilight Zone Tower of Terror
Average Posted Wait
70
Actual Waits Were
80%
7-Day Rank
#3
30-Day Rank
#6
365-Day Rank
#27
Toy Story Mania!
Average Posted Wait
34
Actual Waits Were
68%
7-Day Rank
#5
30-Day Rank
#10
365-Day Rank
#48
Slinky Dog Dash
Average Posted Wait
64
Actual Waits Were
59%
7-Day Rank
#5
30-Day Rank
#11
365-Day Rank
#107
Alien Swirling Saucers
Average Posted Wait
39
7-Day Rank
#1
30-Day Rank
#1
365-Day Rank
#10
Mickey & Minnie’s Runaway Railway
Average Posted Wait
49
Actual Waits Were
79%
7-Day Rank
#6
30-Day Rank
#11
365-Day Rank
#155
Millennium Falcon: Smugglers Run
Average Posted Wait
65
Actual Waits Were
89%
7-Day Rank
#4
30-Day Rank
#7
365-Day Rank
#58

EPCOT Wait Times

Test Track had an average wait time today of 41 minutes. Its 7-day average is 63 minutes, so today ranks #5 for this week. Its 30-day average is 55 minutes, so today ranks #23 for the past month. We received 7 actual wait times today, and the actual wait averaged 51% of the posted wait time.

EPCOT wait times for Wednesday, February 24, 2021
Gran Fiesta Tour Starring The Three Caballeros
Average Posted Wait
5
7-Day Rank
#6
30-Day Rank
#26
365-Day Rank
#232
Journey Into Imagination With Figment
Average Posted Wait
10
7-Day Rank
#5
30-Day Rank
#14
365-Day Rank
#131
Living with the Land
Average Posted Wait
5
7-Day Rank
#5
30-Day Rank
#24
365-Day Rank
#238
Mission: SPACE Orange
Average Posted Wait
29
7-Day Rank
#4
30-Day Rank
#9
365-Day Rank
#81
Soarin’
Average Posted Wait
33
Actual Waits Were
103%
7-Day Rank
#5
30-Day Rank
#12
365-Day Rank
#104
Spaceship Earth
Average Posted Wait
15
Actual Waits Were
44%
7-Day Rank
#5
30-Day Rank
#16
365-Day Rank
#125
Test Track
Average Posted Wait
41
Actual Waits Were
51%
7-Day Rank
#5
30-Day Rank
#23
365-Day Rank
#176
The Seas with Nemo & Friends
Average Posted Wait
9
7-Day Rank
#4
30-Day Rank
#13
365-Day Rank
#134
Frozen Ever After
Average Posted Wait
30
Actual Waits Were
64%
7-Day Rank
#5
30-Day Rank
#12
365-Day Rank
#176

The post More Mellow Lines – Disney World Wait Times for Wednesday, February 24, 2021 appeared first on TouringPlans.com Blog.