

Spring Break continues to churn along. All Walt Disney World theme parks had average posted wait times in the top 10 of the past 30 days, with the exception of Disney’s Hollywood Studios. Rise of the Resistance has been running smoothly in recent days and that seems to have contributed to better wait times throughout the park. We received 294 actual wait times from our Liners, our Lines app users – thank you! At Magic Kingdom today we observed 474 out of 500 guests (95%) wearing their masks in accordance with Disney’s guidelines. Let’s do the numbers!
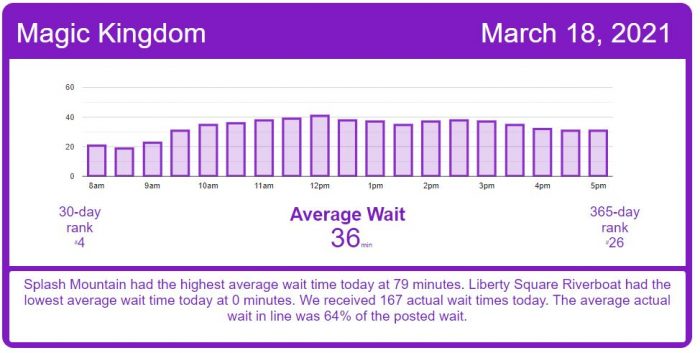
Magic Kingdom Wait Times
Astro Orbiter had an average wait time today of 39 minutes. Its 7-day average is 39 minutes, so today ranks #3 for this week. Its 30-day average is 41 minutes, so today ranks #20 for the past month. Its 365-day average is 31 minutes, so today ranks #62 for the past year.
Big Thunder Mountain Railroad had an average wait time today of 47 minutes. Its 7-day average is 39 minutes, so today ranks #1 for this week. Its 30-day average is 48 minutes, so today ranks #15 for the past month. Its 365-day average is 43 minutes, so today ranks #98 for the past year. We received 22 actual wait times today, and the actual wait averaged 20% of the posted wait time.
Buzz Lightyear’s Space Ranger Spin had an average wait time today of 41 minutes. Its 7-day average is 41 minutes, so today ranks #3 for this week. Its 30-day average is 42 minutes, so today ranks #18 for the past month. We received 12 actual wait times today, and the actual wait averaged 59% of the posted wait time, so the average actual wait was 24 minutes.
“it’s a small world” had an average wait time today of 45 minutes. Its 7-day average is 46 minutes, so today ranks #3 for this week. Its 30-day average is 46 minutes, so today ranks #17 for the past month. Its 365-day average is 35 minutes, so today ranks #41 for the past year. We received 9 actual wait times today, and the actual wait averaged 107% of the posted wait time.
Jungle Cruise had an average wait time today of 60 minutes. Its 7-day average is 50 minutes, so today ranks #1 for this week. Its 30-day average is 47 minutes, so today ranks #1 for the past month. Its 365-day average is 39 minutes, so today ranks #2 for the past year. We received 7 actual wait times today, and the actual wait averaged 114% of the posted wait time.
Pirates of the Caribbean had an average wait time today of 58 minutes. Its 7-day average is 56 minutes, so today ranks #2 for this week. Its 30-day average is 57 minutes, so today ranks #15 for the past month. Its 365-day average is 43 minutes, so today ranks #34 for the past year. We received 14 actual wait times today, and the actual wait averaged 69% of the posted wait time.
Space Mountain had an average wait time today of 52 minutes. Its 7-day average is 54 minutes, so today ranks #4 for this week. Its 30-day average is 48 minutes, so today ranks #12 for the past month. Its 365-day average is 36 minutes, so today ranks #53 for the past year. We received 13 actual wait times today, and the actual wait averaged 73% of the posted wait time.
Splash Mountain had an average wait time today of 79 minutes. Its 7-day average is 79 minutes, so today ranks #4 for this week. Its 30-day average is 70 minutes, so today ranks #8 for the past month. Its 365-day average is 50 minutes, so today ranks #23 for the past year. We received 15 actual wait times today, and the actual wait averaged 71% of the posted wait time.
The Haunted Mansion had an average wait time today of 28 minutes. Its 7-day average is 29 minutes, so today ranks #4 for this week. Its 30-day average is 29 minutes, so today ranks #18 for the past month. We received 21 actual wait times today, and the actual wait averaged 56% of the posted wait time, so the average actual wait was 16 minutes.
Tomorrowland Speedway had an average wait time today of 13 minutes. Its 7-day average is 19 minutes, so today ranks #6 for this week. Its 30-day average is 19 minutes, so today ranks #25 for the past month. Its 365-day average is 16 minutes, so today ranks #147 for the past year. We received 4 actual wait times today, and the actual wait averaged 43% of the posted wait time.
Seven Dwarfs Mine Train had an average wait time today of 63 minutes. Its 7-day average is 63 minutes, so today ranks #3 for this week. Its 30-day average is 67 minutes, so today ranks #17 for the past month. We received 11 actual wait times today, and the actual wait averaged 66% of the posted wait time, so the average actual wait was 45 minutes.
Under the Sea ~ Journey of the Little Mermaid had an average wait time today of 22 minutes. Its 7-day average is 24 minutes, so today ranks #4 for this week. Its 30-day average is 26 minutes, so today ranks #25 for the past month. Its 365-day average is 20 minutes, so today ranks #122 for the past year. We received 6 actual wait times today, and the actual wait averaged 56% of the posted wait time.
EPCOT Wait Times
Gran Fiesta Tour Starring The Three Caballeros had an average wait time today of 5 minutes. Its 7-day average is 11 minutes, so today ranks #6 for this week. Its 30-day average is 9 minutes, so today ranks #29 for the past month. Its 365-day average is 9 minutes, so today ranks #236 for the past year.
Living with the Land had an average wait time today of 16 minutes. Its 7-day average is 13 minutes, so today ranks #1 for this week. Its 30-day average is 9 minutes, so today ranks #1 for the past month. Its 365-day average is 11 minutes, so today ranks #26 for the past year.
Soarin’ had an average wait time today of 70 minutes. Its 7-day average is 62 minutes, so today ranks #1 for this week. Its 30-day average is 46 minutes, so today ranks #1 for the past month. We received 8 actual wait times today, and the actual wait averaged 55% of the posted wait time, so the average actual wait was 39 minutes.
Spaceship Earth had an average wait time today of 33 minutes. Its 7-day average is 32 minutes, so today ranks #1 for this week. Its 30-day average is 24 minutes, so today ranks #2 for the past month. Its 365-day average is 17 minutes, so today ranks #10 for the past year. We received 6 actual wait times today, and the actual wait averaged 49% of the posted wait time.
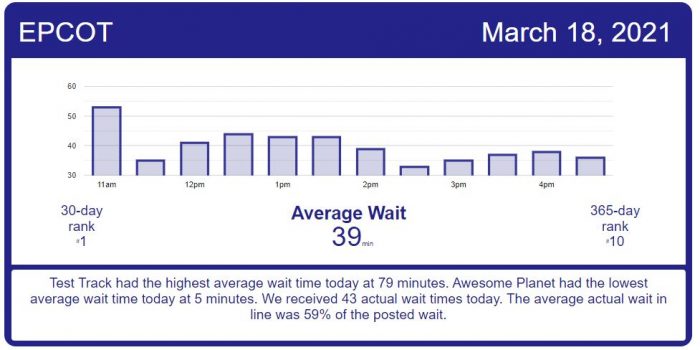
Test Track had an average wait time today of 79 minutes. Its 7-day average is 71 minutes, so today ranks #1 for this week. Its 30-day average is 57 minutes, so today ranks #3 for the past month. We received 7 actual wait times today, and the actual wait averaged 68% of the posted wait time, so the average actual wait was 58 minutes.
The Seas with Nemo & Friends had an average wait time today of 21 minutes. Its 7-day average is 17 minutes, so today ranks #2 for this week. Its 30-day average is 12 minutes, so today ranks #2 for the past month. Its 365-day average is 11 minutes, so today ranks #9 for the past year. We received 7 actual wait times today, and the actual wait averaged 22% of the posted wait time.
Frozen Ever After had an average wait time today of 52 minutes. Its 7-day average is 50 minutes, so today ranks #3 for this week. Its 30-day average is 37 minutes, so today ranks #3 for the past month. Its 365-day average is 45 minutes, so today ranks #83 for the past year. We received 8 actual wait times today, and the actual wait averaged 82% of the posted wait time.
Disney’s Hollywood Studios Wait Times
Rock ‘n’ Roller Coaster Starring Aerosmith had an average wait time today of 50 minutes. Its 7-day average is 45 minutes, so today ranks #1 for this week. Its 30-day average is 44 minutes, so today ranks #5 for the past month. Its 365-day average is 41 minutes, so today ranks #66 for the past year.
Star Tours: The Adventures Continue had an average wait time today of 34 minutes. Its 7-day average is 35 minutes, so today ranks #2 for this week. Its 30-day average is 37 minutes, so today ranks #18 for the past month. We received 9 actual wait times today, and the actual wait averaged 60% of the posted wait time, so the average actual wait was 20 minutes.
Toy Story Mania! had an average wait time today of 31 minutes. Its 7-day average is 34 minutes, so today ranks #6 for this week. Its 30-day average is 35 minutes, so today ranks #27 for the past month. We received 15 actual wait times today, and the actual wait averaged 78% of the posted wait time, so the average actual wait was 21 minutes.
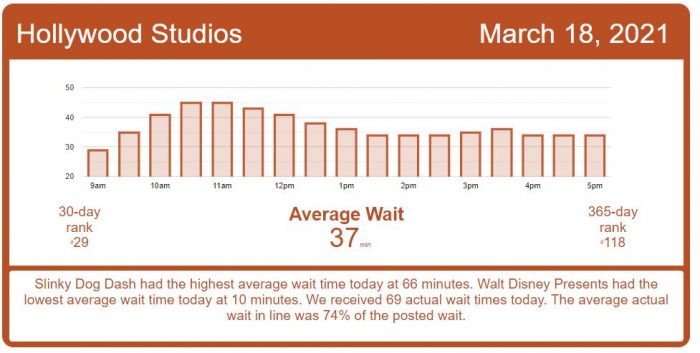
Slinky Dog Dash had an average wait time today of 66 minutes. Its 7-day average is 67 minutes, so today ranks #2 for this week. Its 30-day average is 67 minutes, so today ranks #14 for the past month. Its 365-day average is 58 minutes, so today ranks #81 for the past year. We received 10 actual wait times today, and the actual wait averaged 74% of the posted wait time.
Mickey & Minnie’s Runaway Railway had an average wait time today of 41 minutes. Its 7-day average is 41 minutes, so today ranks #4 for this week. Its 30-day average is 48 minutes, so today ranks #27 for the past month. Its 365-day average is 57 minutes, so today ranks #219 for the past year. We received 12 actual wait times today, and the actual wait averaged 63% of the posted wait time.
Millennium Falcon: Smugglers Run had an average wait time today of 55 minutes. Its 7-day average is 59 minutes, so today ranks #5 for this week. Its 30-day average is 62 minutes, so today ranks #26 for the past month. Its 365-day average is 52 minutes, so today ranks #119 for the past year. We received 7 actual wait times today, and the actual wait averaged 91% of the posted wait time.
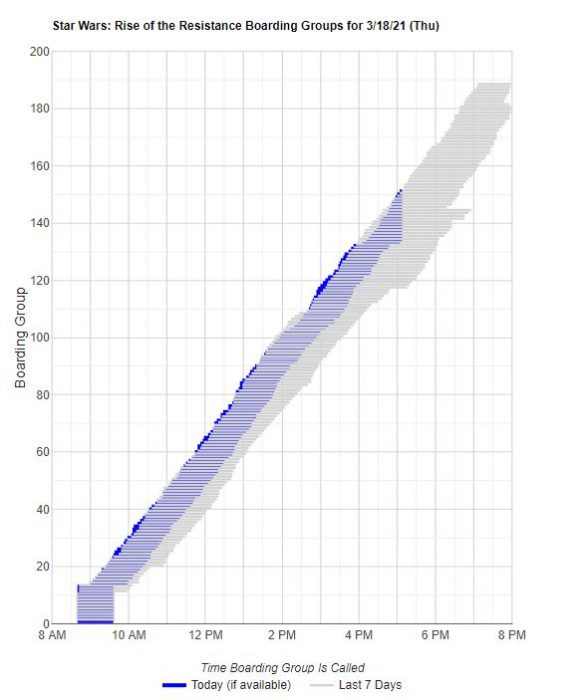
Rise of the Resistance is having a smooth day without any major delays. It looks like Boarding Groups in the 180 range will have no problem being called by day’s end.

Disney’s Animal Kingdom Wait Times
DINOSAUR had an average wait time today of 62 minutes. Its 7-day average is 54 minutes, so today ranks #2 for this week. Its 30-day average is 48 minutes, so today ranks #3 for the past month. Its 365-day average is 31 minutes, so today ranks #16 for the past year.
Expedition Everest – Legend of the Forbidden Mountain had an average wait time today of 31 minutes. Its 7-day average is 30 minutes, so today ranks #2 for this week. Its 30-day average is 23 minutes, so today ranks #5 for the past month. We received 5 actual wait times today, and the actual wait averaged 69% of the posted wait time, so the average actual wait was 21 minutes.
Kilimanjaro Safaris had an average wait time today of 40 minutes. Its 7-day average is 36 minutes, so today ranks #3 for this week. Its 30-day average is 31 minutes, so today ranks #5 for the past month. Its 365-day average is 21 minutes, so today ranks #11 for the past year. We received 4 actual wait times today, and the actual wait averaged 63% of the posted wait time.
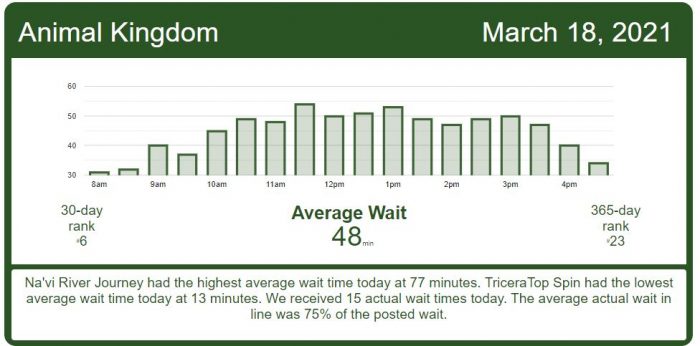
Na’vi River Journey had an average wait time today of 77 minutes. Its 7-day average is 74 minutes, so today ranks #3 for this week. Its 30-day average is 75 minutes, so today ranks #14 for the past month. Its 365-day average is 46 minutes, so today ranks #22 for the past year.
Avatar Flight of Passage had an average wait time today of 75 minutes. Its 7-day average is 70 minutes, so today ranks #2 for this week. Its 30-day average is 59 minutes, so today ranks #6 for the past month. Its 365-day average is 47 minutes, so today ranks #37 for the past year.
The post appeared first on TouringPlans.com Blog.