

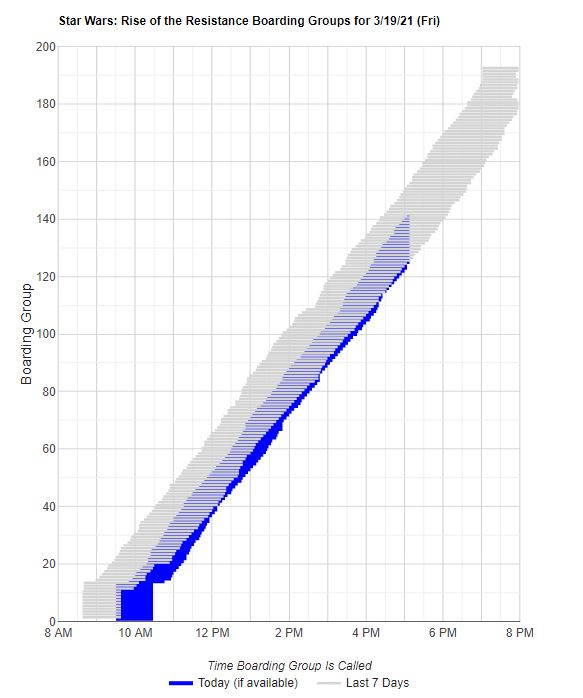
While some parts of the country wrap up their Spring Break, others are getting ready for theirs to start. Today’s posted wait times at Walt Disney World weren’t as high as others days this week, but still it is busy out there. Rise of the Resistance got a late start, but wait times at Disney’s Hollywood Studios were still in the lower part of the past 30 days thanks in part to added efficiencies in ride operations throughout the park.
We received 253 actual wait times from our Lines app users, thank you Liners! Disney’s posted wait times were fairly accurate, about what we expect, aside from Magic Kingdom. Let’s do the numbers!
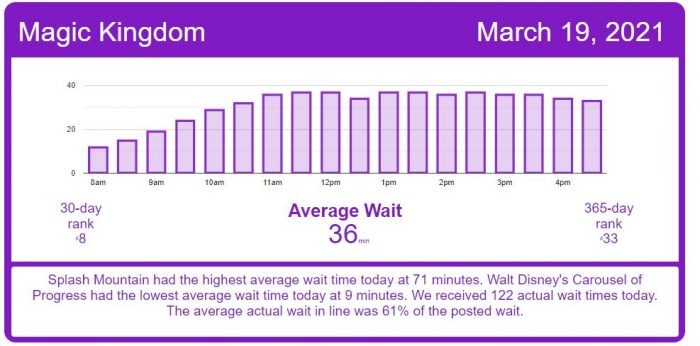
Magic Kingdom Wait Times
Astro Orbiter had an average wait time today of 49 minutes. Its 7-day average is 39 minutes, so today ranks #1 for this week. Its 30-day average is 41 minutes, so today ranks #1 for the past month. Its 365-day average is 31 minutes, so today ranks #3 for the past year.
Big Thunder Mountain Railroad had an average wait time today of 45 minutes. Its 7-day average is 40 minutes, so today ranks #1 for this week. Its 30-day average is 48 minutes, so today ranks #16 for the past month. Its 365-day average is 43 minutes, so today ranks #110 for the past year. We received 26 actual wait times today, and the actual wait averaged 29% of the posted wait time.
Dumbo the Flying Elephant had an average wait time today of 20 minutes. Its 7-day average is 20 minutes, so today ranks #3 for this week. Its 30-day average is 21 minutes, so today ranks #17 for the past month. Its 365-day average is 13 minutes, so today ranks #44 for the past year. We received 5 actual wait times today, and the actual wait averaged 69% of the posted wait time.
Jungle Cruise had an average wait time today of 52 minutes. Its 7-day average is 51 minutes, so today ranks #2 for this week. Its 30-day average is 47 minutes, so today ranks #6 for the past month. We received 5 actual wait times today, and the actual wait averaged 71% of the posted wait time, so the average actual wait was 37 minutes, so the average actual wait was
Mad Tea Party had an average wait time today of 21 minutes. Its 7-day average is 20 minutes, so today ranks #2 for this week. Its 30-day average is 21 minutes, so today ranks #7 for the past month. Its 365-day average is 13 minutes, so today ranks #21 for the past year.
Mickey’s PhilharMagic had an average wait time today of 28 minutes. Its 7-day average is 30 minutes, so today ranks #5 for this week. Its 30-day average is 30 minutes, so today ranks #24 for the past month. Its 365-day average is 20 minutes, so today ranks #61 for the past year.
Pirates of the Caribbean had an average wait time today of 53 minutes. Its 7-day average is 57 minutes, so today ranks #6 for this week. Its 30-day average is 57 minutes, so today ranks #22 for the past month. Its 365-day average is 43 minutes, so today ranks #64 for the past year. We received 10 actual wait times today, and the actual wait averaged 89% of the posted wait time.
Space Mountain had an average wait time today of 60 minutes. Its 7-day average is 54 minutes, so today ranks #1 for this week. Its 30-day average is 48 minutes, so today ranks #2 for the past month. Its 365-day average is 36 minutes, so today ranks #23 for the past year. We received 5 actual wait times today, and the actual wait averaged 59% of the posted wait time.
Splash Mountain had an average wait time today of 71 minutes. Its 7-day average is 79 minutes, so today ranks #5 for this week. Its 30-day average is 71 minutes, so today ranks #14 for the past month. We received 8 actual wait times today, and the actual wait averaged 82% of the posted wait time, so the average actual wait was 58 minutes.
The Barnstormer had an average wait time today of 25 minutes. Its 7-day average is 20 minutes, so today ranks #1 for this week. Its 30-day average is 24 minutes, so today ranks #13 for the past month. Its 365-day average is 18 minutes, so today ranks #68 for the past year. We received 4 actual wait times today, and the actual wait averaged 68% of the posted wait time.
The Many Adventures of Winnie the Pooh had an average wait time today of 28 minutes. Its 7-day average is 29 minutes, so today ranks #3 for this week. Its 30-day average is 30 minutes, so today ranks #19 for the past month. Its 365-day average is 23 minutes, so today ranks #67 for the past year. We received 6 actual wait times today, and the actual wait averaged 89% of the posted wait time.
Seven Dwarfs Mine Train had an average wait time today of 71 minutes. Its 7-day average is 63 minutes, so today ranks #1 for this week. Its 30-day average is 66 minutes, so today ranks #7 for the past month. Its 365-day average is 56 minutes, so today ranks #53 for the past year. We received 7 actual wait times today, and the actual wait averaged 81% of the posted wait time.
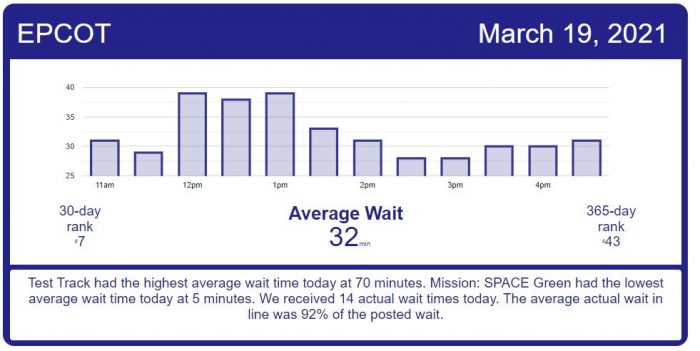
EPCOT Wait Times
Journey Into Imagination With Figment had an average wait time today of 19 minutes. Its 7-day average is 21 minutes, so today ranks #4 for this week. Its 30-day average is 15 minutes, so today ranks #6 for the past month. Its 365-day average is 13 minutes, so today ranks #58 for the past year.
Mission: SPACE Orange had an average wait time today of 41 minutes. Its 7-day average is 51 minutes, so today ranks #5 for this week. Its 30-day average is 36 minutes, so today ranks #8 for the past month. Its 365-day average is 27 minutes, so today ranks #33 for the past year.
Soarin’ had an average wait time today of 55 minutes. Its 7-day average is 65 minutes, so today ranks #5 for this week. Its 30-day average is 46 minutes, so today ranks #7 for the past month. Its 365-day average is 33 minutes, so today ranks #29 for the past year.
Spaceship Earth had an average wait time today of 29 minutes. Its 7-day average is 32 minutes, so today ranks #5 for this week. Its 30-day average is 24 minutes, so today ranks #9 for the past month. Its 365-day average is 17 minutes, so today ranks #36 for the past year.
Test Track had an average wait time today of 70 minutes. Its 7-day average is 74 minutes, so today ranks #4 for this week. Its 30-day average is 56 minutes, so today ranks #5 for the past month. Its 365-day average is 54 minutes, so today ranks #42 for the past year.
Frozen Ever After had an average wait time today of 45 minutes. Its 7-day average is 53 minutes, so today ranks #5 for this week. Its 30-day average is 38 minutes, so today ranks #7 for the past month. Its 365-day average is 45 minutes, so today ranks #103 for the past year.
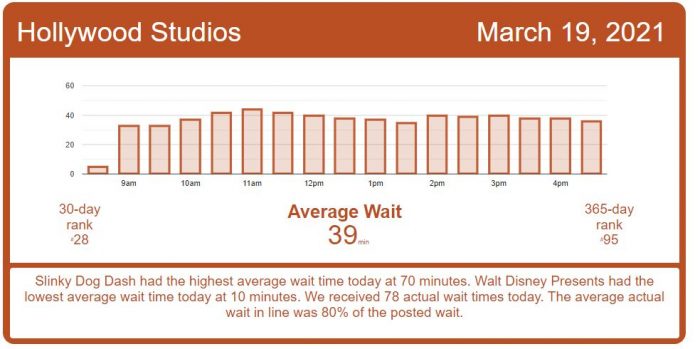
Disney’s Hollywood Studios Wait Times
Muppet*Vision 3D had an average wait time today of 30 minutes. Its 7-day average is 31 minutes, so today ranks #5 for this week. Its 30-day average is 31 minutes, so today ranks #21 for the past month. Its 365-day average is 20 minutes, so today ranks #50 for the past year.
Star Tours: The Adventures Continue had an average wait time today of 36 minutes. Its 7-day average is 34 minutes, so today ranks #1 for this week. Its 30-day average is 37 minutes, so today ranks #15 for the past month. Its 365-day average is 27 minutes, so today ranks #46 for the past year. We received 5 actual wait times today, and the actual wait averaged 64% of the posted wait time.
The Twilight Zone Tower of Terror had an average wait time today of 61 minutes. Its 7-day average is 58 minutes, so today ranks #1 for this week. Its 30-day average is 65 minutes, so today ranks #19 for the past month. Its 365-day average is 50 minutes, so today ranks #61 for the past year. We received 5 actual wait times today, and the actual wait averaged 88% of the posted wait time.
Toy Story Mania! had an average wait time today of 33 minutes. Its 7-day average is 33 minutes, so today ranks #3 for this week. Its 30-day average is 35 minutes, so today ranks #17 for the past month. We received 13 actual wait times today, and the actual wait averaged 76% of the posted wait time, so the average actual wait was 25 minutes.
Slinky Dog Dash had an average wait time today of 70 minutes. Its 7-day average is 68 minutes, so today ranks #1 for this week. Its 30-day average is 67 minutes, so today ranks #8 for the past month. Its 365-day average is 58 minutes, so today ranks #55 for the past year. We received 9 actual wait times today, and the actual wait averaged 81% of the posted wait time.
Mickey & Minnie’s Runaway Railway had an average wait time today of 44 minutes. Its 7-day average is 41 minutes, so today ranks #1 for this week. Its 30-day average is 48 minutes, so today ranks #20 for the past month. We received 19 actual wait times today, and the actual wait averaged 88% of the posted wait time, so the average actual wait was 39 minutes.
Millennium Falcon: Smugglers Run had an average wait time today of 57 minutes. Its 7-day average is 58 minutes, so today ranks #4 for this week. Its 30-day average is 62 minutes, so today ranks #23 for the past month. Its 365-day average is 52 minutes, so today ranks #105 for the past year. We received 8 actual wait times today, and the actual wait averaged 85% of the posted wait time.
Star Wars: Rise of the Resistance had an average wait time today of 65 minutes. Its 7-day average is 68 minutes, so today ranks #5 for this week. Its 30-day average is 58 minutes, so today ranks #15 for the past month. Its 365-day average is 41 minutes, so today ranks #34 for the past year. It got a late start this morning, not operating until after 9:30 a.m. which puts it behind pace of the past 7 days
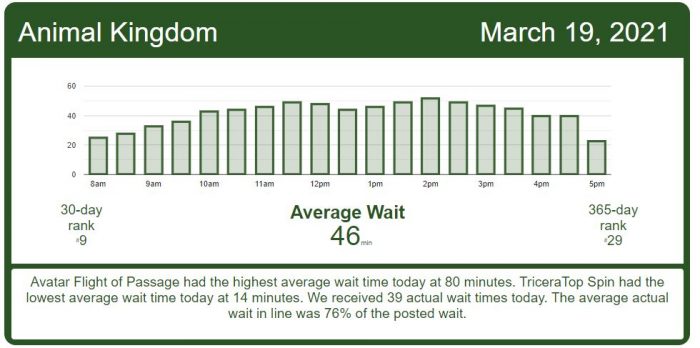
Disney’s Animal Kingdom Wait Times
DINOSAUR had an average wait time today of 51 minutes. Its 7-day average is 58 minutes, so today ranks #5 for this week. Its 30-day average is 48 minutes, so today ranks #13 for the past month. Its 365-day average is 31 minutes, so today ranks #39 for the past year.
Expedition Everest – Legend of the Forbidden Mountain had an average wait time today of 26 minutes. Its 7-day average is 31 minutes, so today ranks #5 for this week. Its 30-day average is 23 minutes, so today ranks #12 for the past month. We received 8 actual wait times today, and the actual wait averaged 75% of the posted wait time, so the average actual wait was 19 minutes.
Kilimanjaro Safaris had an average wait time today of 38 minutes. Its 7-day average is 39 minutes, so today ranks #4 for this week. Its 30-day average is 31 minutes, so today ranks #7 for the past month. We received 14 actual wait times today, and the actual wait averaged 59% of the posted wait time, so the average actual wait was 22 minutes.
It’s Tough to Be a Bug! had an average wait time today of 35 minutes. Its 7-day average is 31 minutes, so today ranks #1 for this week. Its 30-day average is 25 minutes, so today ranks #1 for the past month. Its 365-day average is 15 minutes, so today ranks #1 for the past year.
Na’vi River Journey had an average wait time today of 76 minutes. Its 7-day average is 75 minutes, so today ranks #3 for this week. Its 30-day average is 74 minutes, so today ranks #14 for the past month. Its 365-day average is 46 minutes, so today ranks #23 for the past year. We received 5 actual wait times today, and the actual wait averaged 99% of the posted wait time.
Avatar Flight of Passage had an average wait time today of 80 minutes. Its 7-day average is 74 minutes, so today ranks #1 for this week. Its 30-day average is 60 minutes, so today ranks #3 for the past month. Its 365-day average is 47 minutes, so today ranks #29 for the past year. We received 9 actual wait times today, and the actual wait averaged 86% of the posted wait time.
The post A Slightly Calmer Day – Disney World Wait Times for Friday, March 19, 2021 appeared first on TouringPlans.com Blog.