Flower & Garden Begins! Disney World Wait Times for Wednesday, March 3, 2021

The 2021 version of EPCOT’s Flower and Garden Festival kicked off today, and it drew guests into World Showcase from the other three parks.  Wait times at the Magic Kingdom, Animal Kingdom, and Hollywood Studios were among the lowest they’ve been for the past month. And even then, those posted wait times were overstating more than usual the actual waits in line.

In EPCOT we counted 496 of 500 guests (99%) wearing masks according to Disney’s mask guidelines.  And despite the low crowds, we’ve got 108 actual wait times so far today from our fabulous Lines community.  Let’s do the rest of the numbers!

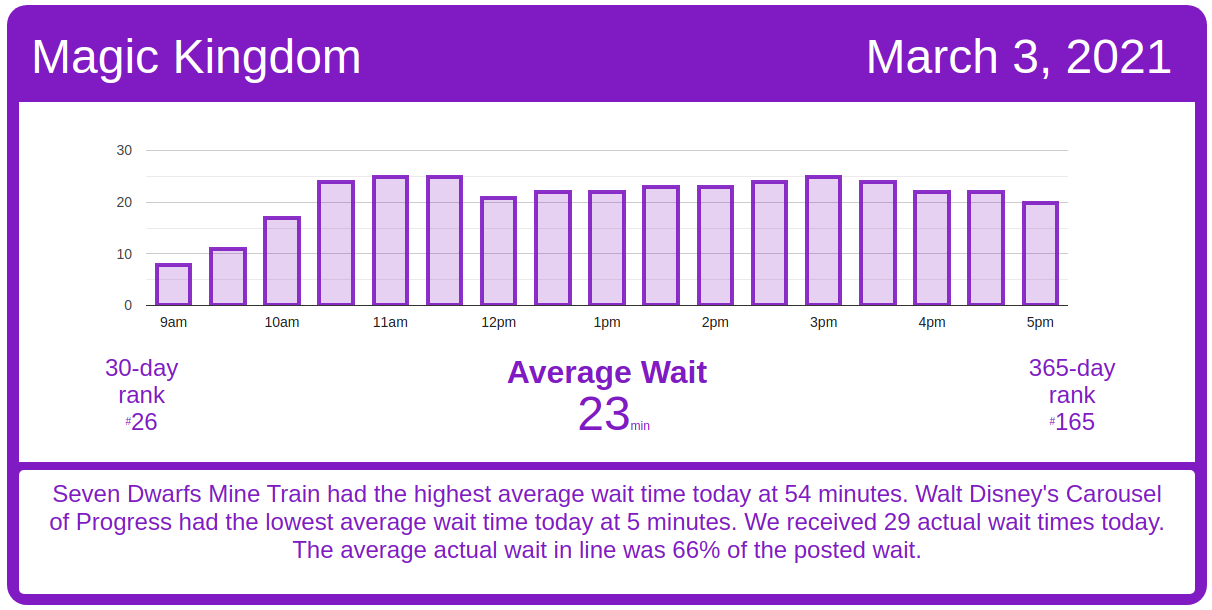
Magic Kingdom Wait Times

Actual wait times we got today at the Magic Kingdom were about one-third lower than the posted wait times.  That’s a little more of a gap than usual.  An example is Big Thunder Mountain Railroad, which had an average wait time today of 35 minutes. Its 7-day average is 52 minutes, so today ranks #6 for this week. Its 30-day average is 51 minutes, so today ranks #26 for the past month. We received 5 actual wait times today, and the actual wait averaged 65% of the posted wait time.

Magic Kingdom wait times for Wednesday, March 3, 2021
Astro Orbiter
Average Posted Wait
30
7-Day Rank
#6
30-Day Rank
#26
365-Day Rank
#135
Big Thunder Mountain Railroad
Average Posted Wait
35
Actual Waits Were
65%
7-Day Rank
#6
30-Day Rank
#26
365-Day Rank
#183
Buzz Lightyear’s Space Ranger Spin
Average Posted Wait
28
7-Day Rank
#6
30-Day Rank
#22
365-Day Rank
#131
Prince Charming Regal Carrousel
Average Posted Wait
34
7-Day Rank
#1
30-Day Rank
#1
365-Day Rank
#1
Country Bear Jamboree
Average Posted Wait
14
7-Day Rank
#1
30-Day Rank
#1
365-Day Rank
#1
Dumbo the Flying Elephant
Average Posted Wait
9
7-Day Rank
#6
30-Day Rank
#25
365-Day Rank
#140
“it’s a small world”
Average Posted Wait
30
7-Day Rank
#6
30-Day Rank
#28
365-Day Rank
#160
Jungle Cruise
Average Posted Wait
34
7-Day Rank
#6
30-Day Rank
#27
365-Day Rank
#164
Mickey’s PhilharMagic
Average Posted Wait
20
7-Day Rank
#6
30-Day Rank
#23
365-Day Rank
#71
Peter Pan’s Flight
Average Posted Wait
23
7-Day Rank
#6
30-Day Rank
#27
365-Day Rank
#201
Pirates of the Caribbean
Average Posted Wait
44
7-Day Rank
#6
30-Day Rank
#21
365-Day Rank
#119
Tom Sawyer Island
Average Posted Wait
15
7-Day Rank
#1
30-Day Rank
#1
365-Day Rank
#1
Space Mountain
Average Posted Wait
27
Actual Waits Were
71%
7-Day Rank
#6
30-Day Rank
#22
365-Day Rank
#152
Splash Mountain
Average Posted Wait
40
7-Day Rank
#6
30-Day Rank
#26
365-Day Rank
#169
The Barnstormer
Average Posted Wait
18
7-Day Rank
#6
30-Day Rank
#24
365-Day Rank
#118
The Haunted Mansion
Average Posted Wait
14
7-Day Rank
#6
30-Day Rank
#27
365-Day Rank
#214
The Magic Carpets of Aladdin
Average Posted Wait
12
7-Day Rank
#6
30-Day Rank
#28
365-Day Rank
#147
The Many Adventures of Winnie the Pooh
Average Posted Wait
19
7-Day Rank
#6
30-Day Rank
#25
365-Day Rank
#168
Tomorrowland Speedway
Average Posted Wait
10
7-Day Rank
#5
30-Day Rank
#24
365-Day Rank
#187
Walt Disney’s Carousel of Progress
Average Posted Wait
5
7-Day Rank
#1
30-Day Rank
#1
365-Day Rank
#1
Seven Dwarfs Mine Train
Average Posted Wait
54
7-Day Rank
#6
30-Day Rank
#22
365-Day Rank
#133
Under the Sea ~ Journey of the Little Mermaid
Average Posted Wait
12
7-Day Rank
#6
30-Day Rank
#26
365-Day Rank
#182

Animal Kingdom Wait Times

Avatar Flight of Passage had an average wait time today of 28 minutes. Its 7-day average is 49 minutes, so today ranks #5 for this week. Its 30-day average is 49 minutes, so today ranks #22 for the past month. Its 365-day average is 49 minutes, so today ranks #172 for the past year. We received 8 actual wait times today, and the actual wait averaged 58% of the posted wait time.

Animal Kingdom wait times for Wednesday, March 3, 2021
DINOSAUR
Average Posted Wait
20
7-Day Rank
#6
30-Day Rank
#26
365-Day Rank
#162
Expedition Everest – Legend of the Forbidden Mountain
Average Posted Wait
9
7-Day Rank
#5
30-Day Rank
#24
365-Day Rank
#231
Kilimanjaro Safaris
Average Posted Wait
15
Actual Waits Were
44%
7-Day Rank
#5
30-Day Rank
#23
365-Day Rank
#158
It’s Tough to Be a Bug!
Average Posted Wait
17
7-Day Rank
#4
30-Day Rank
#16
365-Day Rank
#74
TriceraTop Spin
Average Posted Wait
5
7-Day Rank
#3
30-Day Rank
#10
365-Day Rank
#64
Na’vi River Journey
Average Posted Wait
50
7-Day Rank
#6
30-Day Rank
#20
365-Day Rank
#89
Avatar Flight of Passage
Average Posted Wait
28
Actual Waits Were
58%
7-Day Rank
#5
30-Day Rank
#22
365-Day Rank
#172

Hollywood Studios Wait Times

Mickey & Minnie’s Runaway Railway had an average wait time today of 38 minutes. Its 7-day average is 46 minutes, so today ranks #6 for this week. Its 30-day average is 47 minutes, so today ranks #28 for the past month. Its 365-day average is 60 minutes, so today ranks #233 for the past year. We received 5 actual wait times today, and the actual wait averaged 80% of the posted wait time.

Hollywood Studios wait times for Wednesday, March 3, 2021

Rise of the Resistance had a great morning and early afternoon.  Rise of the Resistance began the day by calling boarding groups 1 through 11 around 8:40 a.m.  Boarding groups got called steadily throughout the day until around 3:45 p.m., when boarding stopped at group 118.  After a delay of about an hour, Rise of the Resistance began calling boarding groups again at 4:45 p.m.  It’ll be a challenge for ROTR to get to boarding group 160 today because of that delay.
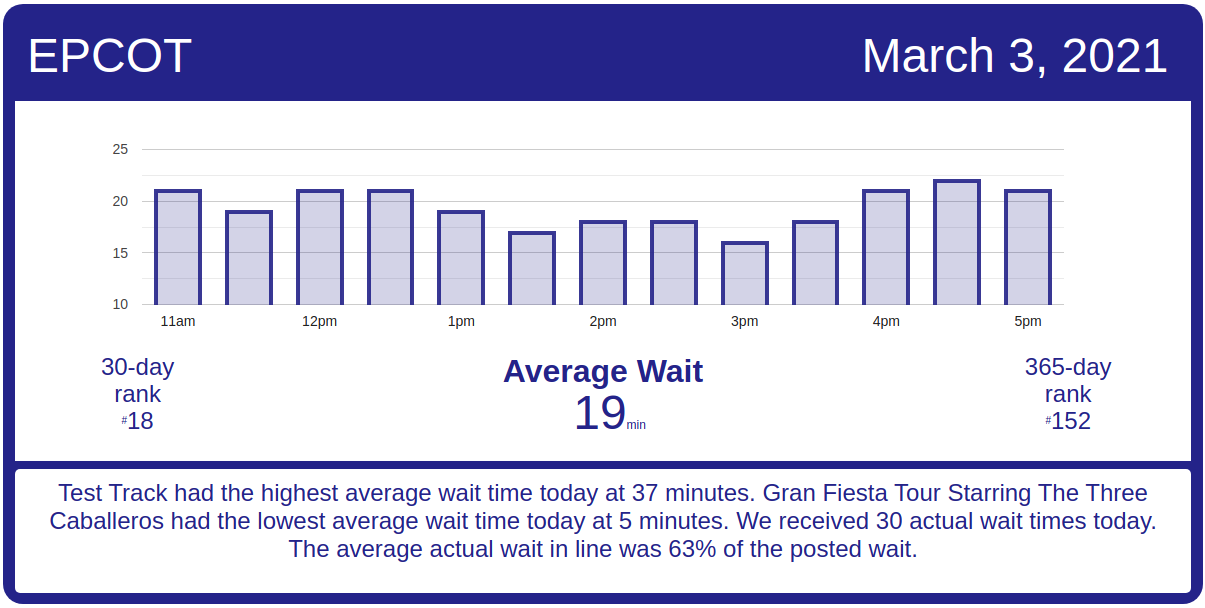
Rise of the Resistance boarding groups for Wednesday, March 3, 2021
Muppet*Vision 3D
Average Posted Wait
32
7-Day Rank
#3
30-Day Rank
#8
365-Day Rank
#23
Rock ‘n’ Roller Coaster Starring Aerosmith
Average Posted Wait
38
7-Day Rank
#4
30-Day Rank
#18
365-Day Rank
#149
Star Tours: The Adventures Continue
Average Posted Wait
29
7-Day Rank
#5
30-Day Rank
#23
365-Day Rank
#100
The Twilight Zone Tower of Terror
Average Posted Wait
58
7-Day Rank
#4
30-Day Rank
#18
365-Day Rank
#62
Toy Story Mania!
Average Posted Wait
33
Actual Waits Were
63%
7-Day Rank
#1
30-Day Rank
#12
365-Day Rank
#54
Walt Disney Presents
Average Posted Wait
10
7-Day Rank
#1
30-Day Rank
#1
365-Day Rank
#1
Slinky Dog Dash
Average Posted Wait
56
Actual Waits Were
69%
7-Day Rank
#5
30-Day Rank
#19
365-Day Rank
#139
Alien Swirling Saucers
Average Posted Wait
27
7-Day Rank
#3
30-Day Rank
#20
365-Day Rank
#84
Mickey & Minnie’s Runaway Railway
Average Posted Wait
38
Actual Waits Were
80%
7-Day Rank
#6
30-Day Rank
#28
365-Day Rank
#233
Millennium Falcon: Smugglers Run
Average Posted Wait
52
7-Day Rank
#6
30-Day Rank
#22
365-Day Rank
#133

EPCOT Wait Times

Test Track had an average wait time today of 37 minutes. Its 7-day average is 42 minutes, so today ranks #4 for this week. Its 30-day average is 54 minutes, so today ranks #25 for the past month. Its 365-day average is 54 minutes, so today ranks #193 for the past year. We received 5 actual wait times today, and the actual wait averaged 54% of the posted wait time.

EPCOT wait times for Wednesday, March 3, 2021
Gran Fiesta Tour Starring The Three Caballeros
Average Posted Wait
5
7-Day Rank
#6
30-Day Rank
#28
365-Day Rank
#233
Journey Into Imagination With Figment
Average Posted Wait
15
7-Day Rank
#1
30-Day Rank
#10
365-Day Rank
#79
Living with the Land
Average Posted Wait
8
7-Day Rank
#1
30-Day Rank
#15
365-Day Rank
#195
Mission: SPACE Orange
Average Posted Wait
24
7-Day Rank
#4
30-Day Rank
#20
365-Day Rank
#114
Soarin’
Average Posted Wait
31
Actual Waits Were
66%
7-Day Rank
#4
30-Day Rank
#17
365-Day Rank
#114
Spaceship Earth
Average Posted Wait
19
7-Day Rank
#1
30-Day Rank
#13
365-Day Rank
#90
Test Track
Average Posted Wait
37
Actual Waits Were
54%
7-Day Rank
#4
30-Day Rank
#25
365-Day Rank
#193
The Seas with Nemo & Friends
Average Posted Wait
7
7-Day Rank
#2
30-Day Rank
#18
365-Day Rank
#206
Frozen Ever After
Average Posted Wait
31
Actual Waits Were
74%
7-Day Rank
#1
30-Day Rank
#11
365-Day Rank
#163

The post Flower & Garden Begins! Disney World Wait Times for Wednesday, March 3, 2021 appeared first on TouringPlans.com Blog.