High Waits at Magic Kingdom & EPCOT – Disney World Wait Times for Monday, March 29, 2021

Average posted wait times at the Magic Kingdom and EPCOT were the highest today they’ve been over the past month, with Animal Kingdom and Hollywood Studios posting middle-of-the-pack numbers.

Magic Kingdom Wait Times

Seven Dwarfs Mine Train had an average wait time today of 69 minutes. Its 7-day average is 59 minutes, so today ranks #1 for this week. Its 30-day average is 62 minutes, so today ranks #4 for the past month. Its 365-day average is 57 minutes, so today ranks #65 for the past year. We received 8 actual wait times today, and the actual wait averaged 71% of the posted wait time.

Magic Kingdom wait times for Monday, March 29, 2021
Astro Orbiter
Average Posted Wait
35
7-Day Rank
#3
30-Day Rank
#23
365-Day Rank
#114
Big Thunder Mountain Railroad
Average Posted Wait
45
Actual Waits Were
32%
7-Day Rank
#1
30-Day Rank
#9
365-Day Rank
#112
Buzz Lightyear’s Space Ranger Spin
Average Posted Wait
43
Actual Waits Were
72%
7-Day Rank
#2
30-Day Rank
#13
365-Day Rank
#44
Prince Charming Regal Carrousel
Average Posted Wait
33
7-Day Rank
#1
30-Day Rank
#1
365-Day Rank
#1
Country Bear Jamboree
Average Posted Wait
28
7-Day Rank
#1
30-Day Rank
#1
365-Day Rank
#1
Dumbo the Flying Elephant
Average Posted Wait
25
7-Day Rank
#1
30-Day Rank
#6
365-Day Rank
#19
“it’s a small world”
Average Posted Wait
51
7-Day Rank
#1
30-Day Rank
#4
365-Day Rank
#15
Jungle Cruise
Average Posted Wait
48
Actual Waits Were
96%
7-Day Rank
#3
30-Day Rank
#14
365-Day Rank
#52
Mad Tea Party
Average Posted Wait
22
7-Day Rank
#1
30-Day Rank
#6
365-Day Rank
#16
Mickey’s PhilharMagic
Average Posted Wait
34
7-Day Rank
#1
30-Day Rank
#1
365-Day Rank
#2
Peter Pan’s Flight
Average Posted Wait
46
Actual Waits Were
95%
7-Day Rank
#2
30-Day Rank
#10
365-Day Rank
#28
Pirates of the Caribbean
Average Posted Wait
64
Actual Waits Were
76%
7-Day Rank
#1
30-Day Rank
#3
365-Day Rank
#8
Tom Sawyer Island
Average Posted Wait
41
7-Day Rank
#1
30-Day Rank
#1
365-Day Rank
#1
Space Mountain
Average Posted Wait
58
Actual Waits Were
83%
7-Day Rank
#1
30-Day Rank
#3
365-Day Rank
#31
Splash Mountain
Average Posted Wait
79
Actual Waits Were
78%
7-Day Rank
#4
30-Day Rank
#12
365-Day Rank
#28
The Barnstormer
Average Posted Wait
24
7-Day Rank
#1
30-Day Rank
#10
365-Day Rank
#81
The Haunted Mansion
Average Posted Wait
33
Actual Waits Were
61%
7-Day Rank
#1
30-Day Rank
#4
365-Day Rank
#69
The Magic Carpets of Aladdin
Average Posted Wait
21
7-Day Rank
#1
30-Day Rank
#5
365-Day Rank
#17
The Many Adventures of Winnie the Pooh
Average Posted Wait
30
Actual Waits Were
79%
7-Day Rank
#2
30-Day Rank
#14
365-Day Rank
#53
Tomorrowland Speedway
Average Posted Wait
31
Actual Waits Were
40%
7-Day Rank
#1
30-Day Rank
#1
365-Day Rank
#10
Seven Dwarfs Mine Train
Average Posted Wait
69
Actual Waits Were
71%
7-Day Rank
#1
30-Day Rank
#4
365-Day Rank
#65
Under the Sea ~ Journey of the Little Mermaid
Average Posted Wait
28
Actual Waits Were
43%
7-Day Rank
#1
30-Day Rank
#9
365-Day Rank
#53

Animal Kingdom Wait Times

Na’vi River Journey had an average wait time today of 43 minutes. Its 7-day average is 43 minutes, so today ranks #3 for this week. Its 30-day average is 66 minutes, so today ranks #26 for the past month. Its 365-day average is 46 minutes, so today ranks #144 for the past year. We received 9 actual wait times today, and the actual wait averaged 50% of the posted wait time.

Animal Kingdom wait times for Monday, March 29, 2021
DINOSAUR
Average Posted Wait
51
Actual Waits Were
121%
7-Day Rank
#1
30-Day Rank
#12
365-Day Rank
#41
Expedition Everest – Legend of the Forbidden Mountain
Average Posted Wait
29
Actual Waits Were
57%
7-Day Rank
#1
30-Day Rank
#5
365-Day Rank
#84
Kali River Rapids
Average Posted Wait
19
7-Day Rank
#1
30-Day Rank
#1
365-Day Rank
#60
Kilimanjaro Safaris
Average Posted Wait
35
Actual Waits Were
57%
7-Day Rank
#3
30-Day Rank
#15
365-Day Rank
#33
It’s Tough to Be a Bug!
Average Posted Wait
35
7-Day Rank
#1
30-Day Rank
#1
365-Day Rank
#1
TriceraTop Spin
Average Posted Wait
11
7-Day Rank
#3
30-Day Rank
#17
365-Day Rank
#24
Na’vi River Journey
Average Posted Wait
43
Actual Waits Were
50%
7-Day Rank
#3
30-Day Rank
#26
365-Day Rank
#144
Avatar Flight of Passage
Average Posted Wait
78
Actual Waits Were
116%
7-Day Rank
#1
30-Day Rank
#6
365-Day Rank
#35

Hollywood Studios Wait Times

Star Tours: The Adventures Continue had an average wait time today of 36 minutes. Its 7-day average is 35 minutes, so today ranks #2 for this week. Its 30-day average is 36 minutes, so today ranks #10 for the past month. Its 365-day average is 28 minutes, so today ranks #47 for the past year. We received 7 actual wait times today, and the actual wait averaged 76% of the posted wait time.

Hollywood Studios wait times for Monday, March 29, 2021

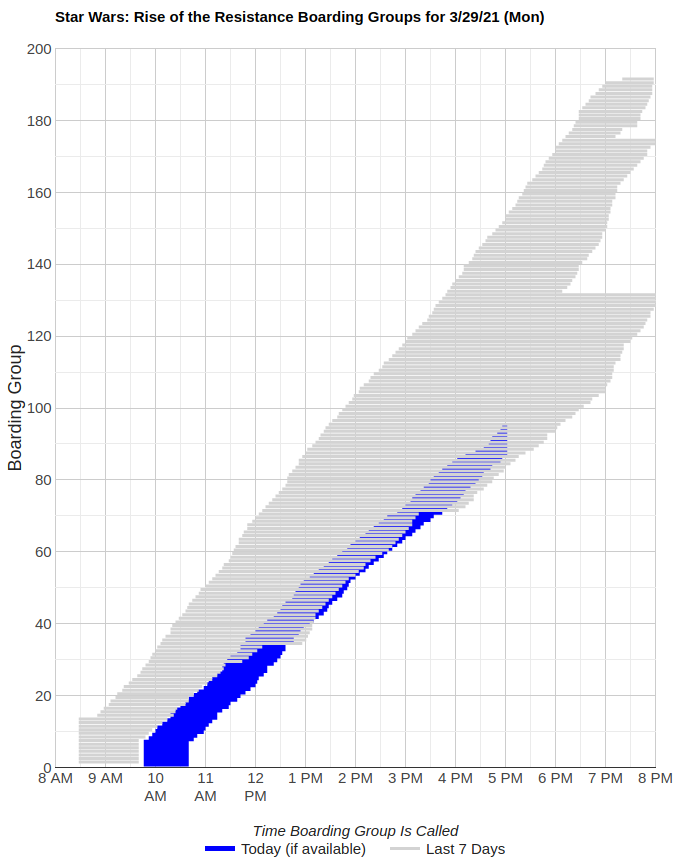
Rise of the the Resistance got a late start today, calling its first boarding groups at 9:45 a.m. instead of 8:45 a.m. That’s the latest start Rise of the Resistance has had all week, putting it behind schedule right off the bat.  At its current pace, Rise of the Resistance looks like it’ll call around 130 boarding groups today, well below its numbers for the past week.

Rise of the Resistance boarding groups for Monday, March 29, 2021
Muppet*Vision 3D
Average Posted Wait
34
7-Day Rank
#3
30-Day Rank
#6
365-Day Rank
#19
Rock ‘n’ Roller Coaster Starring Aerosmith
Average Posted Wait
45
Actual Waits Were
89%
7-Day Rank
#3
30-Day Rank
#12
365-Day Rank
#114
Star Tours: The Adventures Continue
Average Posted Wait
36
Actual Waits Were
76%
7-Day Rank
#2
30-Day Rank
#10
365-Day Rank
#47
The Twilight Zone Tower of Terror
Average Posted Wait
62
Actual Waits Were
84%
7-Day Rank
#5
30-Day Rank
#18
365-Day Rank
#65
Toy Story Mania!
Average Posted Wait
34
Actual Waits Were
87%
7-Day Rank
#4
30-Day Rank
#12
365-Day Rank
#40
Slinky Dog Dash
Average Posted Wait
84
7-Day Rank
#1
30-Day Rank
#1
365-Day Rank
#5
Alien Swirling Saucers
Average Posted Wait
29
7-Day Rank
#2
30-Day Rank
#16
365-Day Rank
#64
Mickey & Minnie’s Runaway Railway
Average Posted Wait
42
Actual Waits Were
84%
7-Day Rank
#3
30-Day Rank
#20
365-Day Rank
#220
Millennium Falcon: Smugglers Run
Average Posted Wait
63
7-Day Rank
#2
30-Day Rank
#11
365-Day Rank
#58

EPCOT Wait Times

Spaceship Earth had an average wait time today of 34 minutes. Its 7-day average is 29 minutes, so today ranks #1 for this week. Its 30-day average is 26 minutes, so today ranks #2 for the past month. Its 365-day average is 18 minutes, so today ranks #11 for the past year. We received 5 actual wait times today, and the actual wait averaged 56% of the posted wait time.

EPCOT wait times for Monday, March 29, 2021
Gran Fiesta Tour Starring The Three Caballeros
Average Posted Wait
20
7-Day Rank
#1
30-Day Rank
#1
365-Day Rank
#2
Journey Into Imagination With Figment
Average Posted Wait
21
Actual Waits Were
48%
7-Day Rank
#1
30-Day Rank
#3
365-Day Rank
#41
Living with the Land
Average Posted Wait
13
7-Day Rank
#2
30-Day Rank
#5
365-Day Rank
#57
Mission: SPACE Orange
Average Posted Wait
60
7-Day Rank
#1
30-Day Rank
#1
365-Day Rank
#7
Soarin’
Average Posted Wait
75
Actual Waits Were
70%
7-Day Rank
#1
30-Day Rank
#1
365-Day Rank
#3
Spaceship Earth
Average Posted Wait
34
Actual Waits Were
56%
7-Day Rank
#1
30-Day Rank
#2
365-Day Rank
#11
Test Track
Average Posted Wait
73
7-Day Rank
#1
30-Day Rank
#7
365-Day Rank
#40
The Seas with Nemo & Friends
Average Posted Wait
23
Actual Waits Were
28%
7-Day Rank
#1
30-Day Rank
#1
365-Day Rank
#6
Mission: SPACE Green
Average Posted Wait
60
7-Day Rank
#1
30-Day Rank
#1
365-Day Rank
#3
Disney & Pixar Short Film Festival
Average Posted Wait
0
7-Day Rank
#2
30-Day Rank
#25
365-Day Rank
#257
Frozen Ever After
Average Posted Wait
58
Actual Waits Were
78%
7-Day Rank
#1
30-Day Rank
#2
365-Day Rank
#73

The post High Waits at Magic Kingdom & EPCOT – Disney World Wait Times for Monday, March 29, 2021 appeared first on TouringPlans.com Blog.