Magic Kingdom and EPCOT Busy – Disney World Wait Times for Monday, March 22, 2021

The Magic Kingdom posted its highest average wait times of the past month today, and EPCOT’s wait times were the second highest. Wait times at Hollywood Studios and Animal Kingdom were more moderate, but not slow.  Maybe everyone’s getting in park time before it hits 90 degrees later this week.

We’ve received 197 actual wait times so far today from our fabulous Lines community.  And we counted 486 of 500 guests (97%) at EPCOT wearing masks according to Disney’s guidelines.  Let’s do the rest of the numbers!

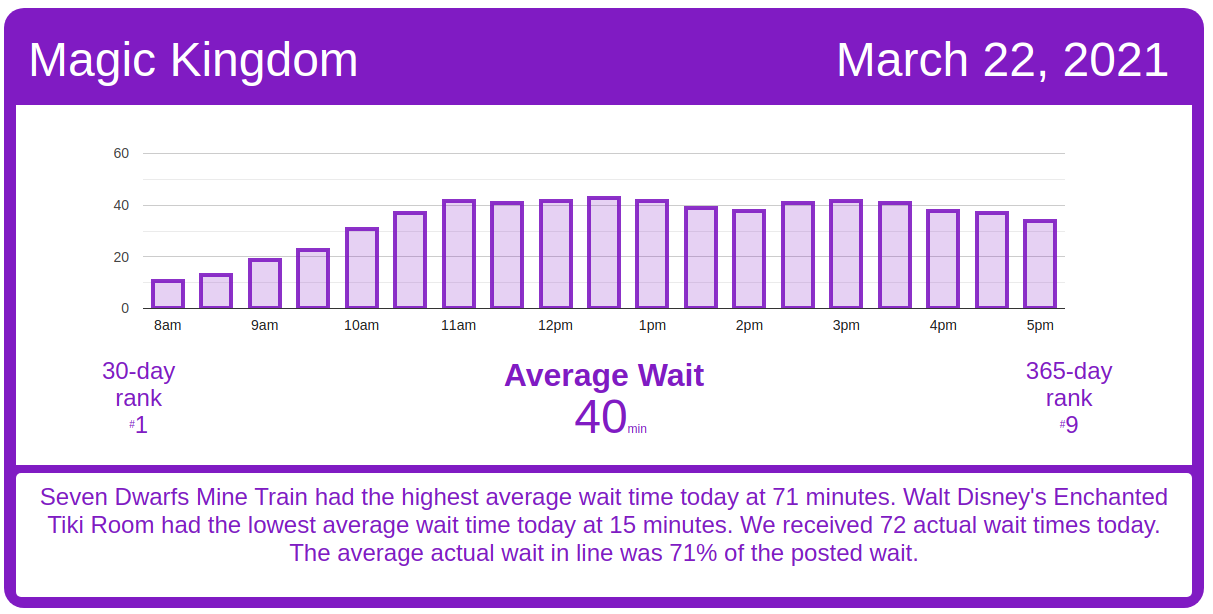
Magic Kingdom Wait Times

Splash Mountain had an average wait time today of 55 minutes. Its 7-day average is 67 minutes, so today ranks #4 for this week. Its 30-day average is 69 minutes, so today ranks #24 for the past month. We received 6 actual wait times today, and the actual wait averaged 63% of the posted wait time.

Magic Kingdom wait times for Monday, March 22, 2021
Astro Orbiter
Average Posted Wait
45
7-Day Rank
#1
30-Day Rank
#3
365-Day Rank
#17
Big Thunder Mountain Railroad
Average Posted Wait
48
Actual Waits Were
26%
7-Day Rank
#1
30-Day Rank
#10
365-Day Rank
#87
Buzz Lightyear’s Space Ranger Spin
Average Posted Wait
45
Actual Waits Were
93%
7-Day Rank
#1
30-Day Rank
#4
365-Day Rank
#19
Prince Charming Regal Carrousel
Average Posted Wait
35
7-Day Rank
#1
30-Day Rank
#1
365-Day Rank
#1
Country Bear Jamboree
Average Posted Wait
25
7-Day Rank
#1
30-Day Rank
#1
365-Day Rank
#1
Dumbo the Flying Elephant
Average Posted Wait
29
Actual Waits Were
89%
7-Day Rank
#1
30-Day Rank
#1
365-Day Rank
#2
“it’s a small world”
Average Posted Wait
53
7-Day Rank
#1
30-Day Rank
#3
365-Day Rank
#7
Jungle Cruise
Average Posted Wait
60
Actual Waits Were
119%
7-Day Rank
#1
30-Day Rank
#1
365-Day Rank
#4
Mad Tea Party
Average Posted Wait
25
7-Day Rank
#1
30-Day Rank
#1
365-Day Rank
#5
Mickey’s PhilharMagic
Average Posted Wait
36
7-Day Rank
#1
30-Day Rank
#1
365-Day Rank
#1
Peter Pan’s Flight
Average Posted Wait
54
Actual Waits Were
110%
7-Day Rank
#1
30-Day Rank
#1
365-Day Rank
#1
Pirates of the Caribbean
Average Posted Wait
63
Actual Waits Were
94%
7-Day Rank
#1
30-Day Rank
#2
365-Day Rank
#13
Space Mountain
Average Posted Wait
57
Actual Waits Were
75%
7-Day Rank
#1
30-Day Rank
#3
365-Day Rank
#30
Splash Mountain
Average Posted Wait
55
Actual Waits Were
63%
7-Day Rank
#4
30-Day Rank
#24
365-Day Rank
#97
The Barnstormer
Average Posted Wait
29
7-Day Rank
#1
30-Day Rank
#4
365-Day Rank
#40
The Haunted Mansion
Average Posted Wait
31
Actual Waits Were
53%
7-Day Rank
#2
30-Day Rank
#7
365-Day Rank
#82
The Magic Carpets of Aladdin
Average Posted Wait
21
7-Day Rank
#1
30-Day Rank
#7
365-Day Rank
#17
The Many Adventures of Winnie the Pooh
Average Posted Wait
33
Actual Waits Were
79%
7-Day Rank
#1
30-Day Rank
#6
365-Day Rank
#20
Tomorrowland Speedway
Average Posted Wait
26
7-Day Rank
#1
30-Day Rank
#1
365-Day Rank
#23
Seven Dwarfs Mine Train
Average Posted Wait
71
Actual Waits Were
61%
7-Day Rank
#1
30-Day Rank
#3
365-Day Rank
#51
Under the Sea ~ Journey of the Little Mermaid
Average Posted Wait
30
7-Day Rank
#1
30-Day Rank
#3
365-Day Rank
#37

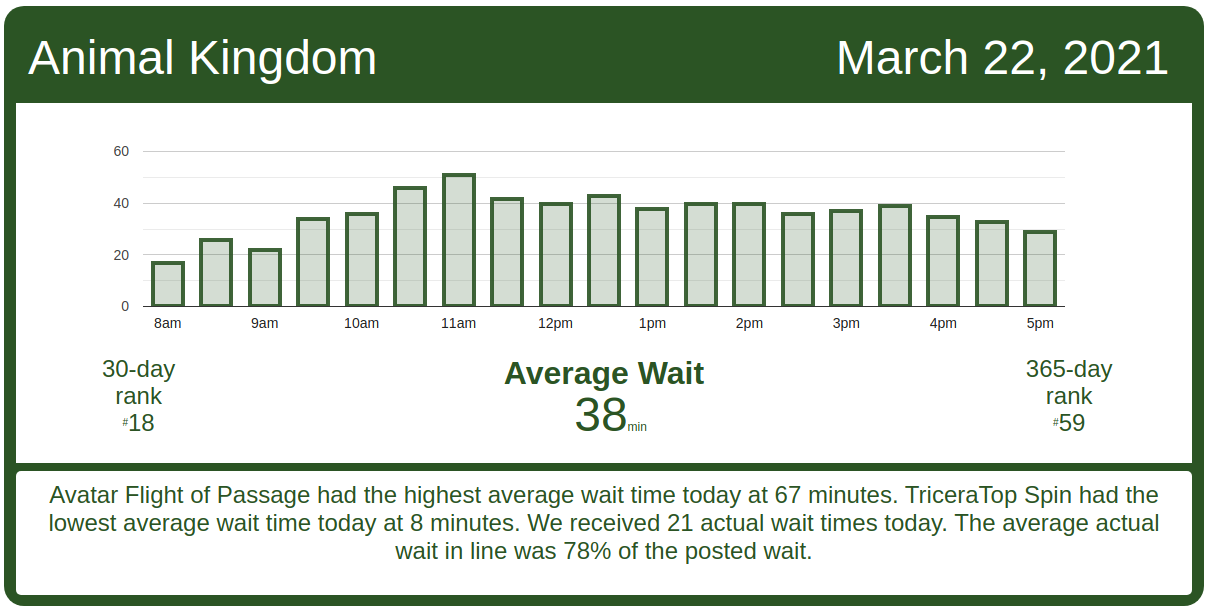
Animal Kingdom Wait Times

Kilimanjaro Safaris had an average wait time today of 40 minutes. Its 7-day average is 41 minutes, so today ranks #4 for this week. Its 30-day average is 32 minutes, so today ranks #6 for the past month.  We received 6 actual wait times today, and the actual wait averaged 96% of the posted wait time.

Animal Kingdom wait times for Monday, March 22, 2021
DINOSAUR
Average Posted Wait
55
7-Day Rank
#2
30-Day Rank
#8
365-Day Rank
#33
Expedition Everest – Legend of the Forbidden Mountain
Average Posted Wait
22
7-Day Rank
#6
30-Day Rank
#17
365-Day Rank
#132
Kilimanjaro Safaris
Average Posted Wait
40
Actual Waits Were
96%
7-Day Rank
#4
30-Day Rank
#6
365-Day Rank
#14
It’s Tough to Be a Bug!
Average Posted Wait
32
7-Day Rank
#5
30-Day Rank
#6
365-Day Rank
#16
TriceraTop Spin
Average Posted Wait
8
7-Day Rank
#6
30-Day Rank
#19
365-Day Rank
#47
Na’vi River Journey
Average Posted Wait
48
Actual Waits Were
66%
7-Day Rank
#6
30-Day Rank
#29
365-Day Rank
#111
Avatar Flight of Passage
Average Posted Wait
67
Actual Waits Were
73%
7-Day Rank
#6
30-Day Rank
#13
365-Day Rank
#64

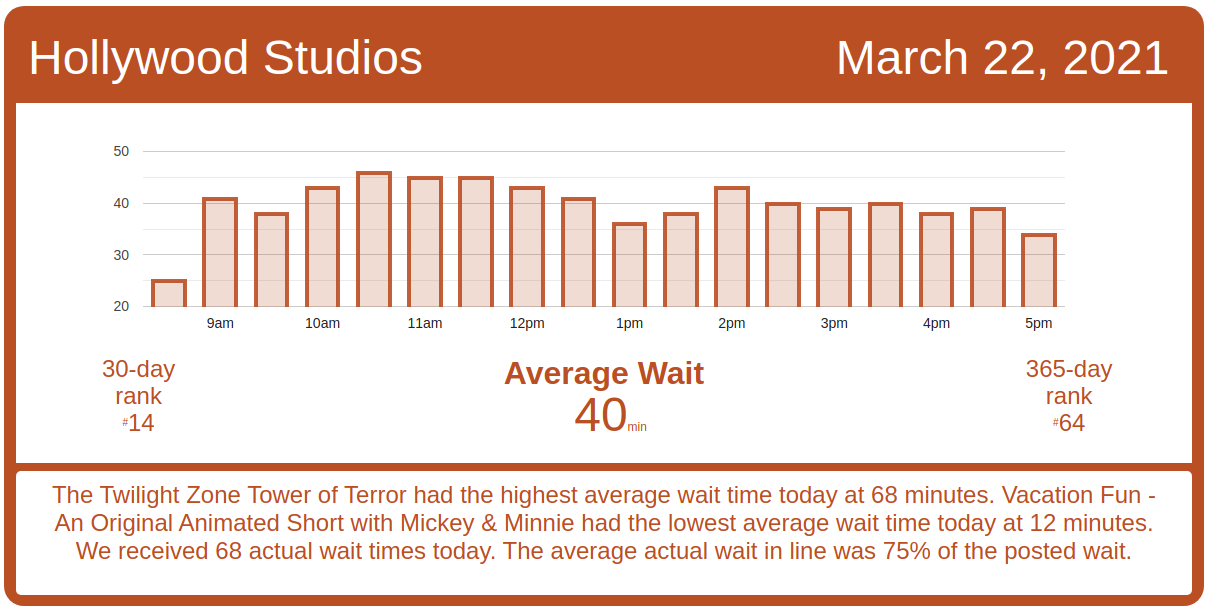
Hollywood Studios Wait Times

Toy Story Mania! had an average wait time today of 35 minutes. Its 7-day average is 34 minutes, so today ranks #1 for this week. Its 30-day average is 35 minutes, so today ranks #8 for the past month. Its 365-day average is 26 minutes, so today ranks #29 for the past year. We received 13 actual wait times today, and the actual wait averaged 83% of the posted wait time.

Hollywood Studios wait times for Monday, March 22, 2021

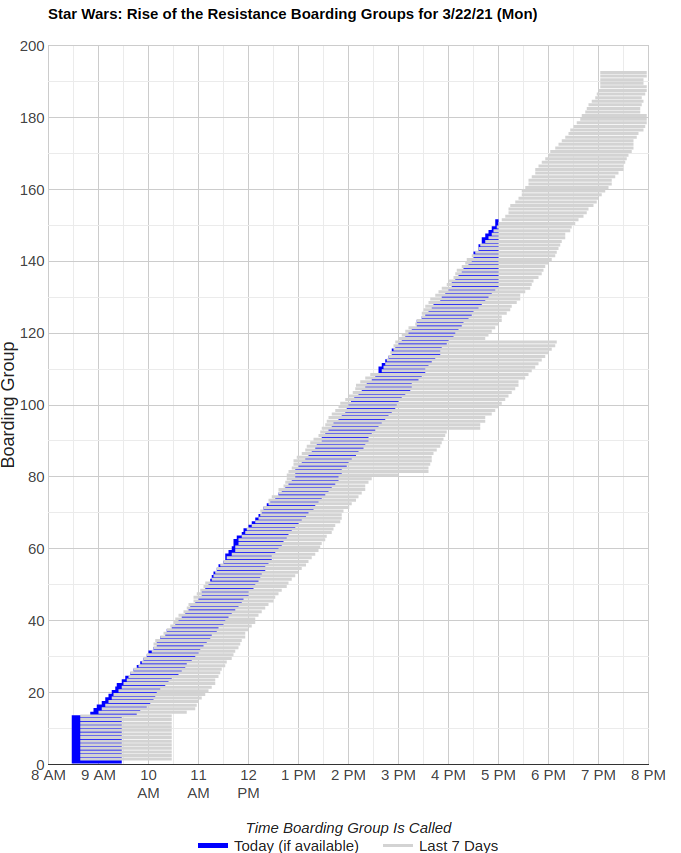
Rise of the Resistance is having another excellent day of operations.  Rise started calling boarding groups today at 8:30 a.m., and hasn’t had even a blip of trouble since.  It’s possible Rise could call over 190 boarding groups today, assuming they gave out that many.
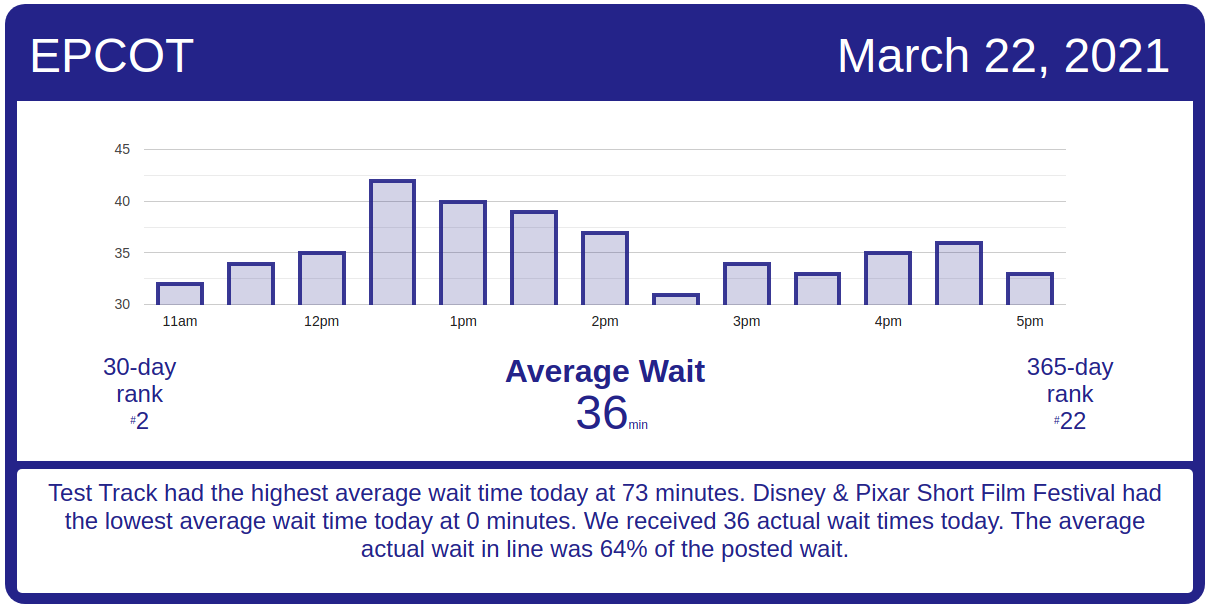
Rise of the Resistance boarding groups for Monday, March 22, 2021
Muppet*Vision 3D
Average Posted Wait
33
7-Day Rank
#2
30-Day Rank
#11
365-Day Rank
#24
Rock ‘n’ Roller Coaster Starring Aerosmith
Average Posted Wait
44
Actual Waits Were
90%
7-Day Rank
#2
30-Day Rank
#12
365-Day Rank
#119
Star Tours: The Adventures Continue
Average Posted Wait
35
7-Day Rank
#4
30-Day Rank
#16
365-Day Rank
#53
The Twilight Zone Tower of Terror
Average Posted Wait
68
Actual Waits Were
87%
7-Day Rank
#1
30-Day Rank
#6
365-Day Rank
#31
Toy Story Mania!
Average Posted Wait
35
Actual Waits Were
83%
7-Day Rank
#1
30-Day Rank
#8
365-Day Rank
#29
Walt Disney Presents
Average Posted Wait
20
7-Day Rank
#1
30-Day Rank
#1
365-Day Rank
#1
Slinky Dog Dash
Average Posted Wait
68
Actual Waits Were
64%
7-Day Rank
#3
30-Day Rank
#9
365-Day Rank
#74
Alien Swirling Saucers
Average Posted Wait
33
Actual Waits Were
63%
7-Day Rank
#1
30-Day Rank
#8
365-Day Rank
#21
Mickey & Minnie’s Runaway Railway
Average Posted Wait
47
Actual Waits Were
72%
7-Day Rank
#1
30-Day Rank
#11
365-Day Rank
#156
Millennium Falcon: Smugglers Run
Average Posted Wait
65
7-Day Rank
#1
30-Day Rank
#7
365-Day Rank
#42

EPCOT Wait Times

The Seas with Nemo & Friends had an average wait time today of 20 minutes. Its 7-day average is 17 minutes, so today ranks #1 for this week. Its 30-day average is 12 minutes, so today ranks #2 for the past month. Its 365-day average is 11 minutes, so today ranks #12 for the past year. We received 7 actual wait times today, and the actual wait averaged 26% of the posted wait time.

EPCOT wait times for Monday, March 22, 2021
Gran Fiesta Tour Starring The Three Caballeros
Average Posted Wait
18
7-Day Rank
#1
30-Day Rank
#1
365-Day Rank
#9
Journey Into Imagination With Figment
Average Posted Wait
19
7-Day Rank
#3
30-Day Rank
#6
365-Day Rank
#60
Living with the Land
Average Posted Wait
13
Actual Waits Were
28%
7-Day Rank
#1
30-Day Rank
#4
365-Day Rank
#55
Mission: SPACE Orange
Average Posted Wait
51
7-Day Rank
#3
30-Day Rank
#4
365-Day Rank
#17
Soarin’
Average Posted Wait
59
Actual Waits Were
91%
7-Day Rank
#3
30-Day Rank
#5
365-Day Rank
#22
Spaceship Earth
Average Posted Wait
33
Actual Waits Were
59%
7-Day Rank
#1
30-Day Rank
#1
365-Day Rank
#10
Test Track
Average Posted Wait
73
7-Day Rank
#5
30-Day Rank
#6
365-Day Rank
#39
The Seas with Nemo & Friends
Average Posted Wait
20
Actual Waits Were
26%
7-Day Rank
#1
30-Day Rank
#2
365-Day Rank
#12
Mission: SPACE Green
Average Posted Wait
25
7-Day Rank
#1
30-Day Rank
#1
365-Day Rank
#13
Frozen Ever After
Average Posted Wait
51
Actual Waits Were
88%
7-Day Rank
#2
30-Day Rank
#3
365-Day Rank
#86

The post Magic Kingdom and EPCOT Busy – Disney World Wait Times for Monday, March 22, 2021 appeared first on TouringPlans.com Blog.