Moderate Crowds – Disney World Wait Times for Saturday, March 13, 2021

Wait times were moderate throughout Walt Disney World today, partly due to increased ride capacity at key attractions.  Average wait times at all four parks were between 31 and 39 minutes.  And we’ve got 205 actual wait times so far today from our fabulous Lines community!  Let’s do the rest of the numbers!

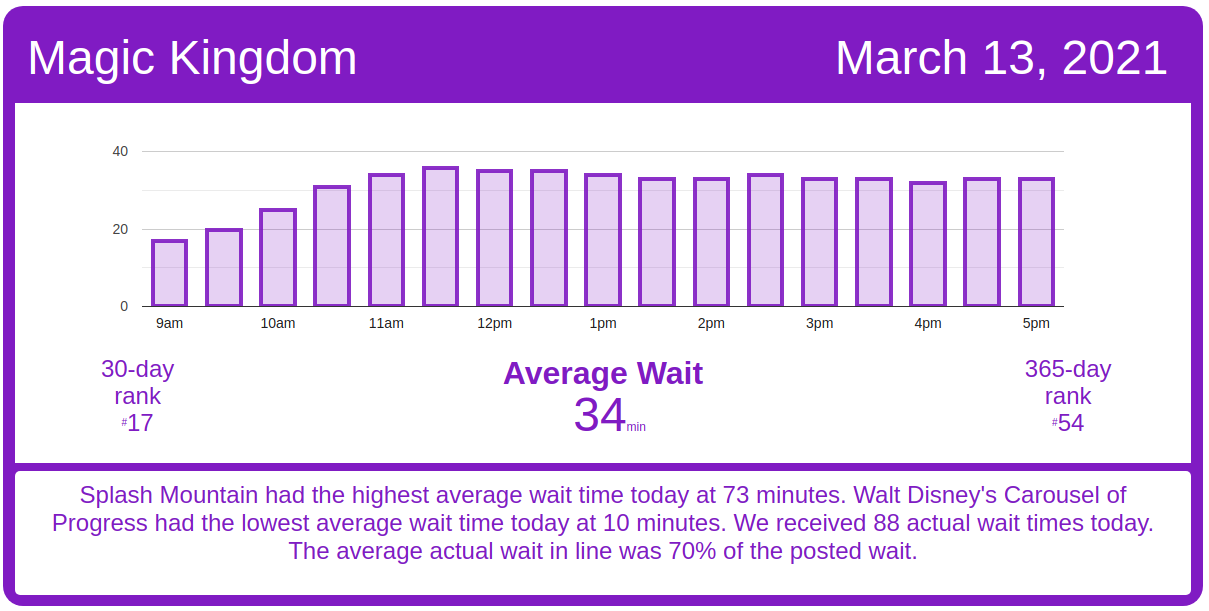
Magic Kingdom Wait Times

Big Thunder Mountain Railroad had an average wait time today of 35 minutes. Its 7-day average is 46 minutes, so today ranks #6 for this week. Its 30-day average is 52 minutes, so today ranks #27 for the past month. Its 365-day average is 43 minutes, so today ranks #179 for the past year. We received 18 actual wait times today, and the actual wait averaged 32% of the posted wait time.

Magic Kingdom wait times for Saturday, March 13, 2021
Astro Orbiter
Average Posted Wait
36
7-Day Rank
#6
30-Day Rank
#25
365-Day Rank
#79
Big Thunder Mountain Railroad
Average Posted Wait
35
Actual Waits Were
32%
7-Day Rank
#6
30-Day Rank
#27
365-Day Rank
#179
Buzz Lightyear’s Space Ranger Spin
Average Posted Wait
45
Actual Waits Were
72%
7-Day Rank
#3
30-Day Rank
#13
365-Day Rank
#24
Prince Charming Regal Carrousel
Average Posted Wait
41
7-Day Rank
#1
30-Day Rank
#1
365-Day Rank
#1
Country Bear Jamboree
Average Posted Wait
25
7-Day Rank
#1
30-Day Rank
#1
365-Day Rank
#1
Dumbo the Flying Elephant
Average Posted Wait
17
7-Day Rank
#5
30-Day Rank
#25
365-Day Rank
#66
“it’s a small world”
Average Posted Wait
45
7-Day Rank
#4
30-Day Rank
#20
365-Day Rank
#45
Jungle Cruise
Average Posted Wait
41
7-Day Rank
#6
30-Day Rank
#24
365-Day Rank
#110
Mad Tea Party
Average Posted Wait
17
7-Day Rank
#6
30-Day Rank
#18
365-Day Rank
#43
Mickey’s PhilharMagic
Average Posted Wait
32
7-Day Rank
#2
30-Day Rank
#8
365-Day Rank
#27
Peter Pan’s Flight
Average Posted Wait
40
Actual Waits Were
94%
7-Day Rank
#7
30-Day Rank
#22
365-Day Rank
#62
Pirates of the Caribbean
Average Posted Wait
56
Actual Waits Were
96%
7-Day Rank
#4
30-Day Rank
#19
365-Day Rank
#44
Tom Sawyer Island
Average Posted Wait
45
7-Day Rank
#1
30-Day Rank
#1
365-Day Rank
#1
Space Mountain
Average Posted Wait
45
Actual Waits Were
77%
7-Day Rank
#6
30-Day Rank
#20
365-Day Rank
#82
Splash Mountain
Average Posted Wait
73
Actual Waits Were
99%
7-Day Rank
#4
30-Day Rank
#11
365-Day Rank
#31
The Barnstormer
Average Posted Wait
16
7-Day Rank
#6
30-Day Rank
#28
365-Day Rank
#136
The Haunted Mansion
Average Posted Wait
27
Actual Waits Were
32%
7-Day Rank
#6
30-Day Rank
#21
365-Day Rank
#125
The Magic Carpets of Aladdin
Average Posted Wait
15
7-Day Rank
#6
30-Day Rank
#27
365-Day Rank
#75
The Many Adventures of Winnie the Pooh
Average Posted Wait
26
Actual Waits Were
74%
7-Day Rank
#6
30-Day Rank
#28
365-Day Rank
#98
Tomorrowland Speedway
Average Posted Wait
21
7-Day Rank
#3
30-Day Rank
#14
365-Day Rank
#53
Walt Disney’s Carousel of Progress
Average Posted Wait
10
7-Day Rank
#1
30-Day Rank
#1
365-Day Rank
#1
Seven Dwarfs Mine Train
Average Posted Wait
56
Actual Waits Were
67%
7-Day Rank
#6
30-Day Rank
#27
365-Day Rank
#122
Under the Sea ~ Journey of the Little Mermaid
Average Posted Wait
21
Actual Waits Were
56%
7-Day Rank
#6
30-Day Rank
#27
365-Day Rank
#123

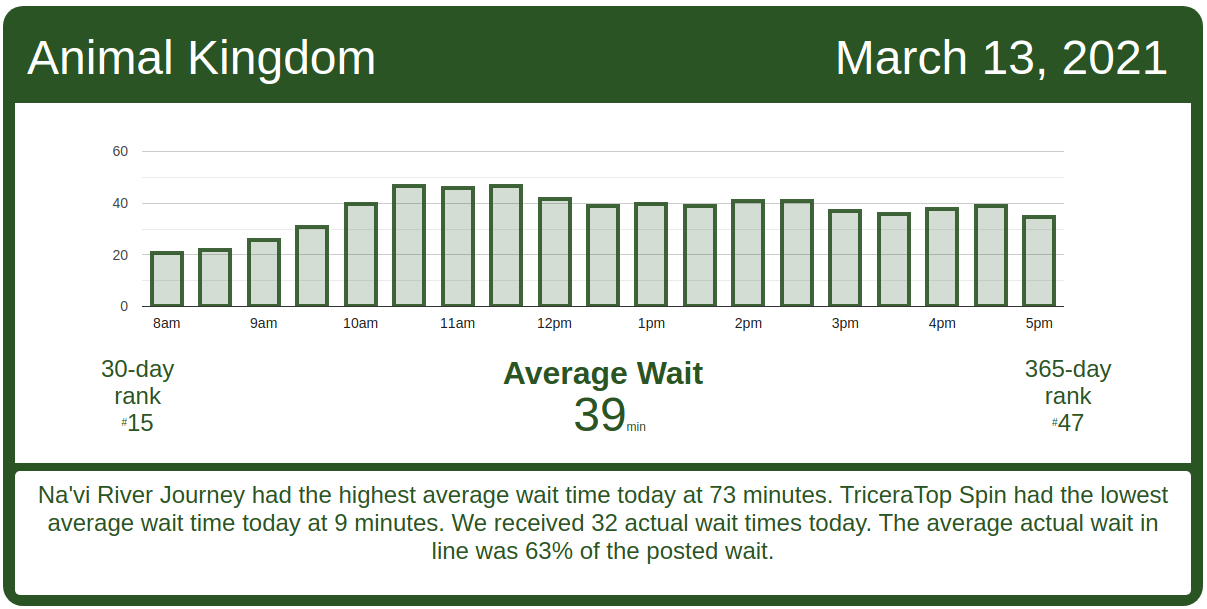
Animal Kingdom Wait Times

Kilimanjaro Safaris had an average wait time today of 33 minutes. Its 7-day average is 36 minutes, so today ranks #4 for this week. Its 30-day average is 31 minutes, so today ranks #12 for the past month. Its 365-day average is 21 minutes, so today ranks #33 for the past year. We received 12 actual wait times today, and the actual wait averaged 49% of the posted wait time.

Animal Kingdom wait times for Saturday, March 13, 2021
DINOSAUR
Average Posted Wait
54
7-Day Rank
#5
30-Day Rank
#12
365-Day Rank
#34
Expedition Everest – Legend of the Forbidden Mountain
Average Posted Wait
24
Actual Waits Were
64%
7-Day Rank
#5
30-Day Rank
#15
365-Day Rank
#117
Kilimanjaro Safaris
Average Posted Wait
33
Actual Waits Were
49%
7-Day Rank
#4
30-Day Rank
#12
365-Day Rank
#33
It’s Tough to Be a Bug!
Average Posted Wait
31
7-Day Rank
#1
30-Day Rank
#4
365-Day Rank
#14
TriceraTop Spin
Average Posted Wait
9
7-Day Rank
#6
30-Day Rank
#13
365-Day Rank
#28
Na’vi River Journey
Average Posted Wait
73
7-Day Rank
#5
30-Day Rank
#15
365-Day Rank
#22
Avatar Flight of Passage
Average Posted Wait
61
Actual Waits Were
75%
7-Day Rank
#5
30-Day Rank
#13
365-Day Rank
#74

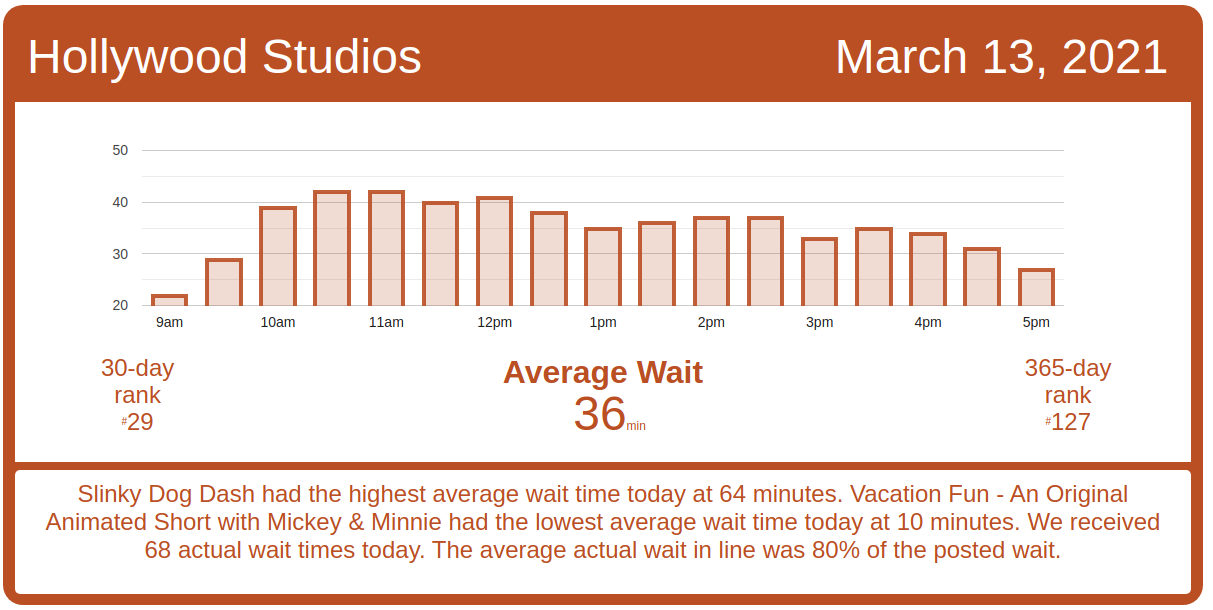
Hollywood Studios Wait Times

Rock ‘n’ Roller Coaster Starring Aerosmith had an average wait time today of 46 minutes. Its 7-day average is 51 minutes, so today ranks #5 for this week. Its 30-day average is 45 minutes, so today ranks #14 for the past month. Its 365-day average is 41 minutes, so today ranks #106 for the past year. We received 11 actual wait times today, and the actual wait averaged 70% of the posted wait time.

Hollywood Studio wait times for Saturday, March 13, 2021

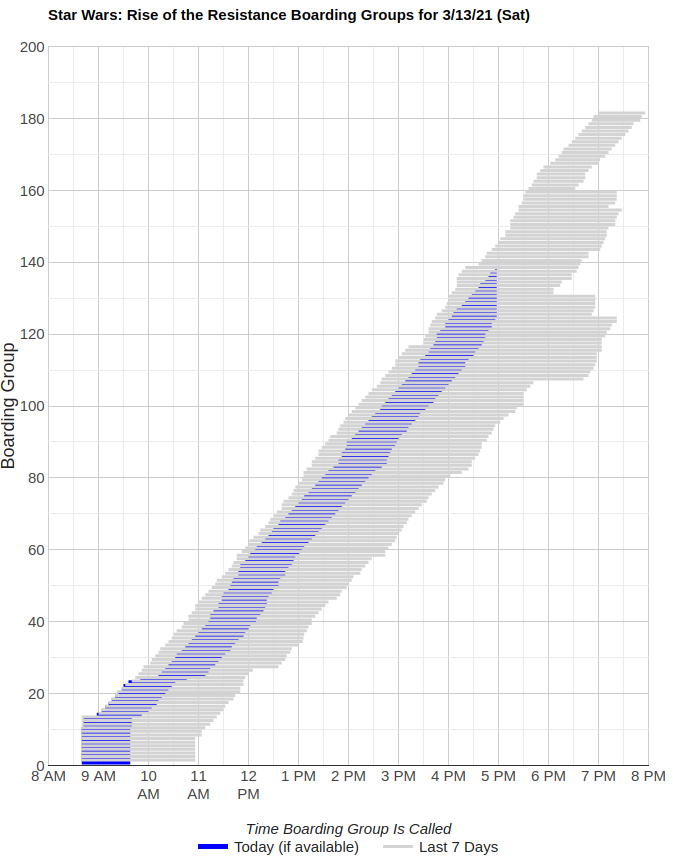
Rise of the Resistance is having an excellent day of operations!
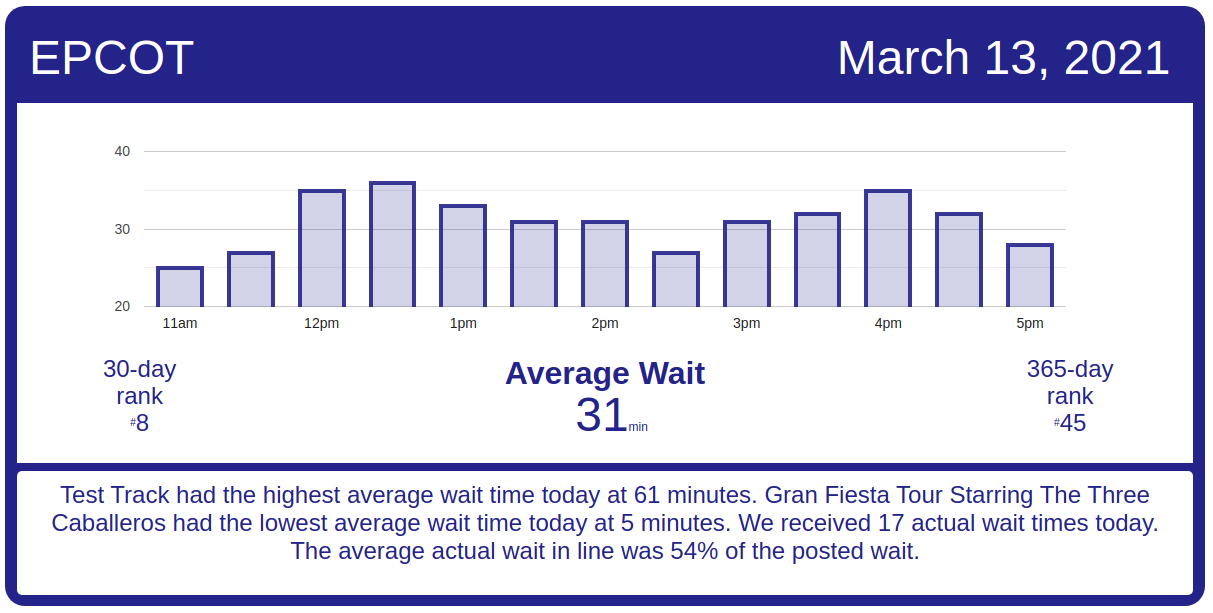
Rise of the Resistance boarding groups for Saturday, March 13, 2021
Muppet*Vision 3D
Average Posted Wait
28
7-Day Rank
#6
30-Day Rank
#26
365-Day Rank
#63
Rock ‘n’ Roller Coaster Starring Aerosmith
Average Posted Wait
46
Actual Waits Were
70%
7-Day Rank
#5
30-Day Rank
#14
365-Day Rank
#106
Star Tours: The Adventures Continue
Average Posted Wait
32
Actual Waits Were
80%
7-Day Rank
#6
30-Day Rank
#24
365-Day Rank
#81
The Twilight Zone Tower of Terror
Average Posted Wait
56
Actual Waits Were
98%
7-Day Rank
#6
30-Day Rank
#27
365-Day Rank
#78
Toy Story Mania!
Average Posted Wait
33
Actual Waits Were
78%
7-Day Rank
#6
30-Day Rank
#20
365-Day Rank
#52
Walt Disney Presents
Average Posted Wait
20
7-Day Rank
#1
30-Day Rank
#1
365-Day Rank
#1
Slinky Dog Dash
Average Posted Wait
64
Actual Waits Were
79%
7-Day Rank
#6
30-Day Rank
#18
365-Day Rank
#99
Alien Swirling Saucers
Average Posted Wait
26
7-Day Rank
#6
30-Day Rank
#26
365-Day Rank
#88
Mickey & Minnie’s Runaway Railway
Average Posted Wait
38
Actual Waits Were
83%
7-Day Rank
#6
30-Day Rank
#31
365-Day Rank
#234
Millennium Falcon: Smugglers Run
Average Posted Wait
63
Actual Waits Were
93%
7-Day Rank
#4
30-Day Rank
#15
365-Day Rank
#58

EPCOT Wait Times

Soarin’ had an average wait time today of 57 minutes. Its 7-day average is 52 minutes, so today ranks #1 for this week. Its 30-day average is 44 minutes, so today ranks #5 for the past month. Its 365-day average is 32 minutes, so today ranks #20 for the past year. We received 4 actual wait times today, and the actual wait averaged 43% of the posted wait time.

EPCOT wait times for Saturday, March 13, 2021
Gran Fiesta Tour Starring The Three Caballeros
Average Posted Wait
5
7-Day Rank
#6
30-Day Rank
#30
365-Day Rank
#233
Journey Into Imagination With Figment
Average Posted Wait
19
7-Day Rank
#1
30-Day Rank
#6
365-Day Rank
#54
Living with the Land
Average Posted Wait
13
7-Day Rank
#1
30-Day Rank
#6
365-Day Rank
#74
Mission: SPACE Orange
Average Posted Wait
41
7-Day Rank
#3
30-Day Rank
#5
365-Day Rank
#29
Soarin’
Average Posted Wait
57
Actual Waits Were
43%
7-Day Rank
#1
30-Day Rank
#5
365-Day Rank
#20
Spaceship Earth
Average Posted Wait
28
7-Day Rank
#1
30-Day Rank
#9
365-Day Rank
#32
Test Track
Average Posted Wait
61
Actual Waits Were
58%
7-Day Rank
#1
30-Day Rank
#10
365-Day Rank
#83
The Seas with Nemo & Friends
Average Posted Wait
15
7-Day Rank
#1
30-Day Rank
#5
365-Day Rank
#30
Mission: SPACE Green
Average Posted Wait
35
7-Day Rank
#1
30-Day Rank
#1
365-Day Rank
#10
Frozen Ever After
Average Posted Wait
41
7-Day Rank
#4
30-Day Rank
#9
365-Day Rank
#117

The post Moderate Crowds – Disney World Wait Times for Saturday, March 13, 2021 appeared first on TouringPlans.com Blog.