Moderate Crowds – Disney World Wait Times for Saturday, March 20, 2021

Wait times throughout Walt Disney World were moderate today, with only EPCOT’s average posted wait times reaching the top 10 for the past month.  The Magic Kingdom’s posted wait times today were the 12th-highest of the past month, but those seem to be inflated.  We’ve got almost 90 actual wait times so far from the Magic Kingdom, and those waits are averaging just 60% of the posted waits.

We received 216 actual wait times so far today from our fabulous Lines community. Let’s do the rest of the numbers!

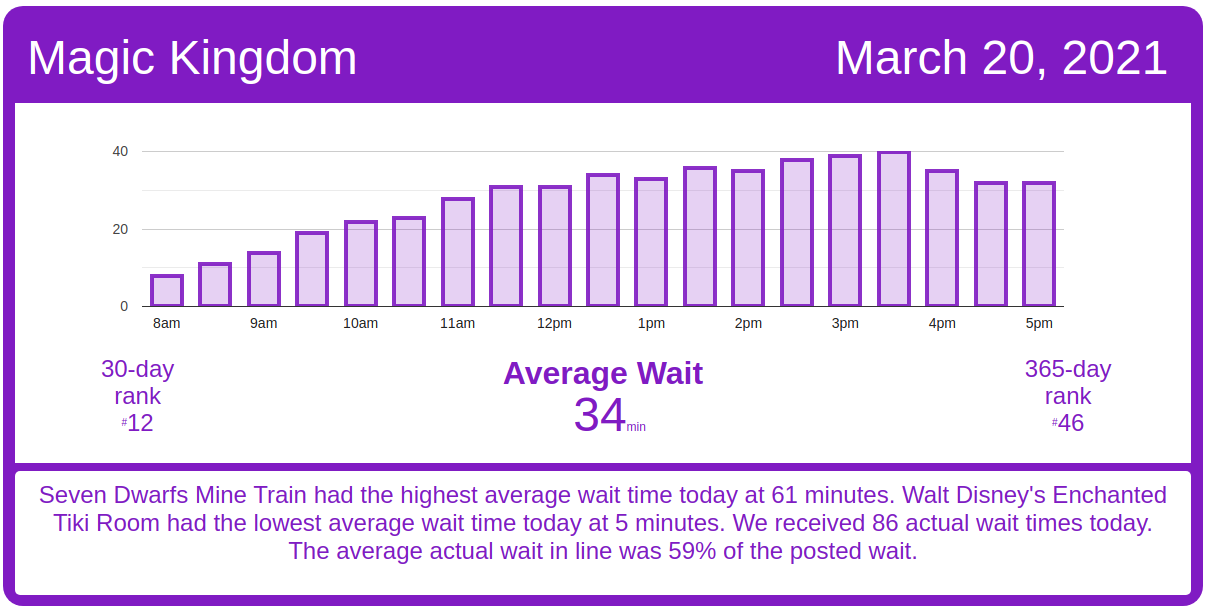
Magic Kingdom Wait Times

Space Mountain had an average wait time today of 51 minutes. Its 7-day average is 56 minutes, so today ranks #6 for this week. Its 30-day average is 48 minutes, so today ranks #13 for the past month. Its 365-day average is 36 minutes, so today ranks #60 for the past year. We received 9 actual wait times today, and the actual wait averaged 60% of the posted wait time.

Magic Kingdom wait times for Saturday, March 20, 2021
Astro Orbiter
Average Posted Wait
40
7-Day Rank
#3
30-Day Rank
#18
365-Day Rank
#59
Big Thunder Mountain Railroad
Average Posted Wait
41
Actual Waits Were
26%
7-Day Rank
#2
30-Day Rank
#20
365-Day Rank
#140
Buzz Lightyear’s Space Ranger Spin
Average Posted Wait
43
Actual Waits Were
69%
7-Day Rank
#1
30-Day Rank
#11
365-Day Rank
#34
Prince Charming Regal Carrousel
Average Posted Wait
44
7-Day Rank
#1
30-Day Rank
#1
365-Day Rank
#1
Country Bear Jamboree
Average Posted Wait
20
7-Day Rank
#1
30-Day Rank
#1
365-Day Rank
#1
Dumbo the Flying Elephant
Average Posted Wait
25
7-Day Rank
#1
30-Day Rank
#7
365-Day Rank
#17
“it’s a small world”
Average Posted Wait
46
7-Day Rank
#1
30-Day Rank
#12
365-Day Rank
#38
Jungle Cruise
Average Posted Wait
47
7-Day Rank
#5
30-Day Rank
#17
365-Day Rank
#56
Mad Tea Party
Average Posted Wait
20
7-Day Rank
#4
30-Day Rank
#12
365-Day Rank
#30
Mickey’s PhilharMagic
Average Posted Wait
33
7-Day Rank
#1
30-Day Rank
#1
365-Day Rank
#11
Peter Pan’s Flight
Average Posted Wait
43
Actual Waits Were
99%
7-Day Rank
#2
30-Day Rank
#11
365-Day Rank
#36
Pirates of the Caribbean
Average Posted Wait
54
Actual Waits Were
82%
7-Day Rank
#4
30-Day Rank
#20
365-Day Rank
#59
Tom Sawyer Island
Average Posted Wait
28
7-Day Rank
#1
30-Day Rank
#1
365-Day Rank
#1
Space Mountain
Average Posted Wait
51
Actual Waits Were
60%
7-Day Rank
#6
30-Day Rank
#13
365-Day Rank
#60
Splash Mountain
Average Posted Wait
42
Actual Waits Were
49%
7-Day Rank
#6
30-Day Rank
#29
365-Day Rank
#165
The Barnstormer
Average Posted Wait
24
7-Day Rank
#2
30-Day Rank
#14
365-Day Rank
#76
The Haunted Mansion
Average Posted Wait
28
Actual Waits Were
59%
7-Day Rank
#3
30-Day Rank
#16
365-Day Rank
#115
The Magic Carpets of Aladdin
Average Posted Wait
21
7-Day Rank
#1
30-Day Rank
#7
365-Day Rank
#15
The Many Adventures of Winnie the Pooh
Average Posted Wait
29
Actual Waits Were
71%
7-Day Rank
#3
30-Day Rank
#18
365-Day Rank
#66
Tomorrowland Speedway
Average Posted Wait
20
7-Day Rank
#1
30-Day Rank
#10
365-Day Rank
#56
Seven Dwarfs Mine Train
Average Posted Wait
61
Actual Waits Were
57%
7-Day Rank
#5
30-Day Rank
#23
365-Day Rank
#103
Under the Sea ~ Journey of the Little Mermaid
Average Posted Wait
22
7-Day Rank
#6
30-Day Rank
#25
365-Day Rank
#122

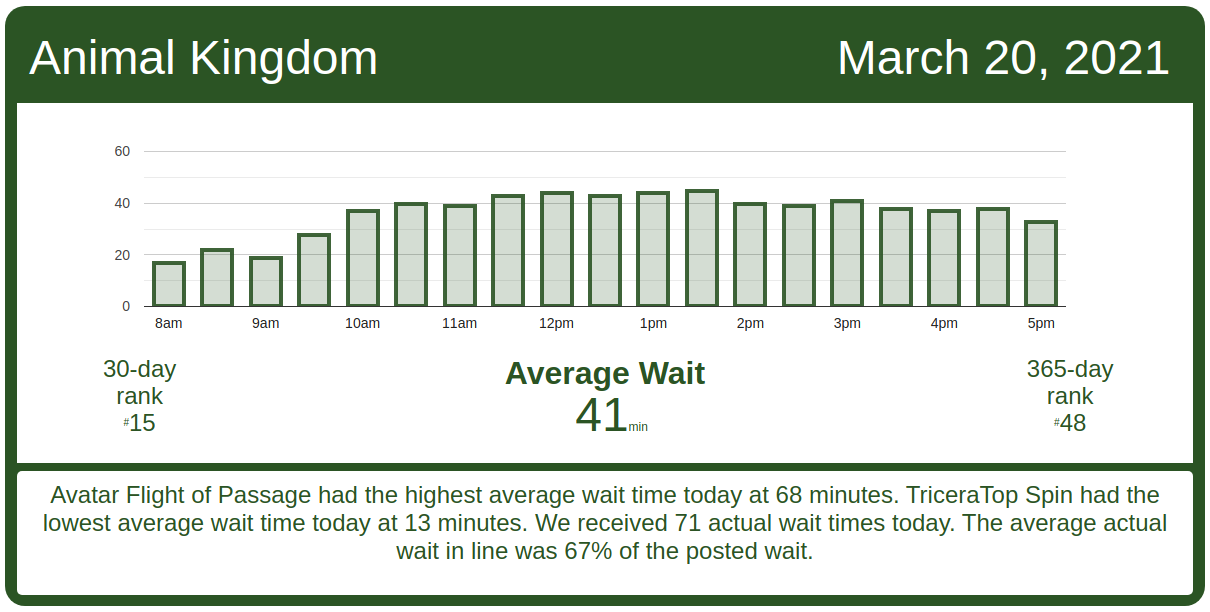
Animal Kingdom Wait Times

Kilimanjaro Safaris had an average wait time today of 31 minutes. Its 7-day average is 40 minutes, so today ranks #5 for this week. Its 30-day average is 31 minutes, so today ranks #14 for the past month. Its 365-day average is 21 minutes, so today ranks #48 for the past year. We received 16 actual wait times today, and the actual wait averaged 46% of the posted wait time.

Animal Kingdom wait times for Saturday, March 20, 2021
DINOSAUR
Average Posted Wait
55
Actual Waits Were
93%
7-Day Rank
#3
30-Day Rank
#9
365-Day Rank
#35
Expedition Everest – Legend of the Forbidden Mountain
Average Posted Wait
25
Actual Waits Were
61%
7-Day Rank
#6
30-Day Rank
#13
365-Day Rank
#109
Kilimanjaro Safaris
Average Posted Wait
31
Actual Waits Were
46%
7-Day Rank
#5
30-Day Rank
#14
365-Day Rank
#48
It’s Tough to Be a Bug!
Average Posted Wait
34
7-Day Rank
#1
30-Day Rank
#1
365-Day Rank
#4
TriceraTop Spin
Average Posted Wait
13
7-Day Rank
#6
30-Day Rank
#12
365-Day Rank
#16
Na’vi River Journey
Average Posted Wait
64
Actual Waits Were
78%
7-Day Rank
#6
30-Day Rank
#23
365-Day Rank
#48
Avatar Flight of Passage
Average Posted Wait
68
Actual Waits Were
71%
7-Day Rank
#5
30-Day Rank
#10
365-Day Rank
#57

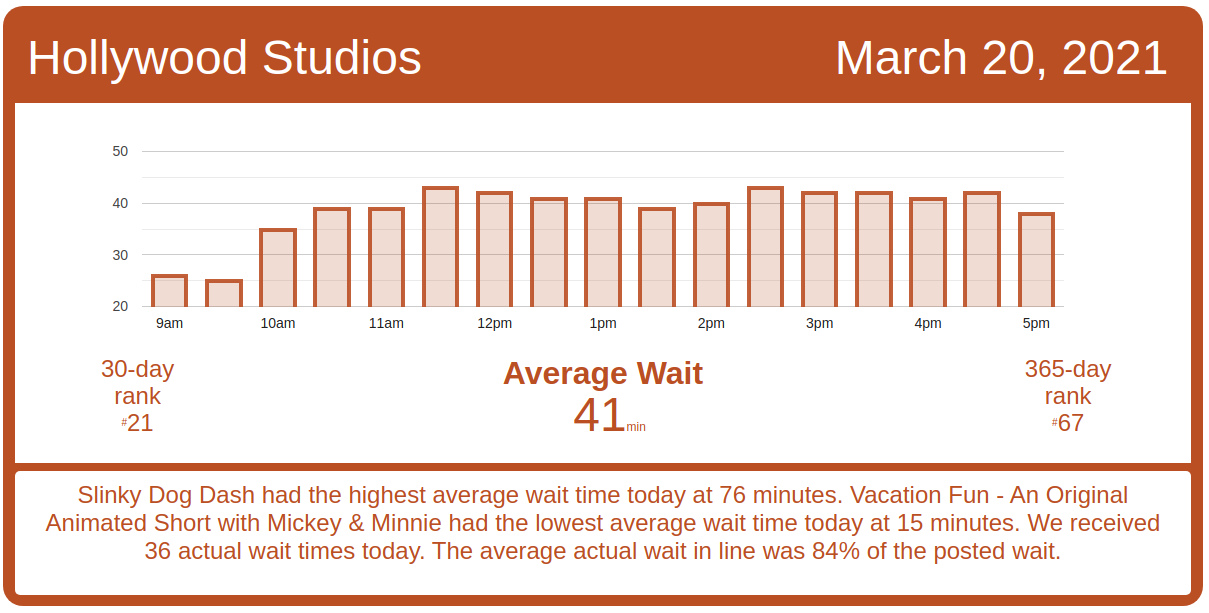
Hollywood Studios Wait Times

Mickey & Minnie’s Runaway Railway had an average wait time today of 41 minutes. Its 7-day average is 42 minutes, so today ranks #3 for this week. Its 30-day average is 47 minutes, so today ranks #24 for the past month.  We received 6 actual wait times today, and the actual wait averaged 86% of the posted wait time.

Hollywood Studios wait times for Saturday, March 20, 2021

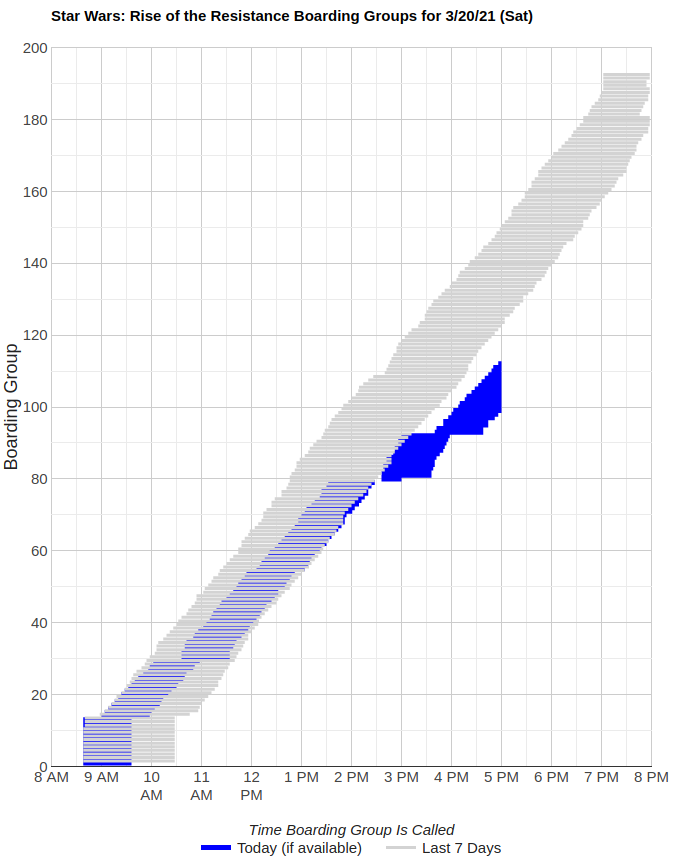
Rise of the Resistance is having a rough day. The day started off well, with the first set of boarding groups – I think groups 1 to 14 – called around 8:40 a.m.  Things ran well until just after 10 a.m. and boarding group 29, when there was a delay of around 30 minutes in calling more groups.  A second delay in calling boarding groups happened around 1:30 p.m. at boarding group 79. That delay lasted about an hour and 10 minutes, making today the slowest pace in a week for calling boarding groups.  And a third delay around boarding group 87 at 3:10 p.m. didn’t help. At this rate, Rise of the Resistance is unlikely to call 160 boarding groups for the day.
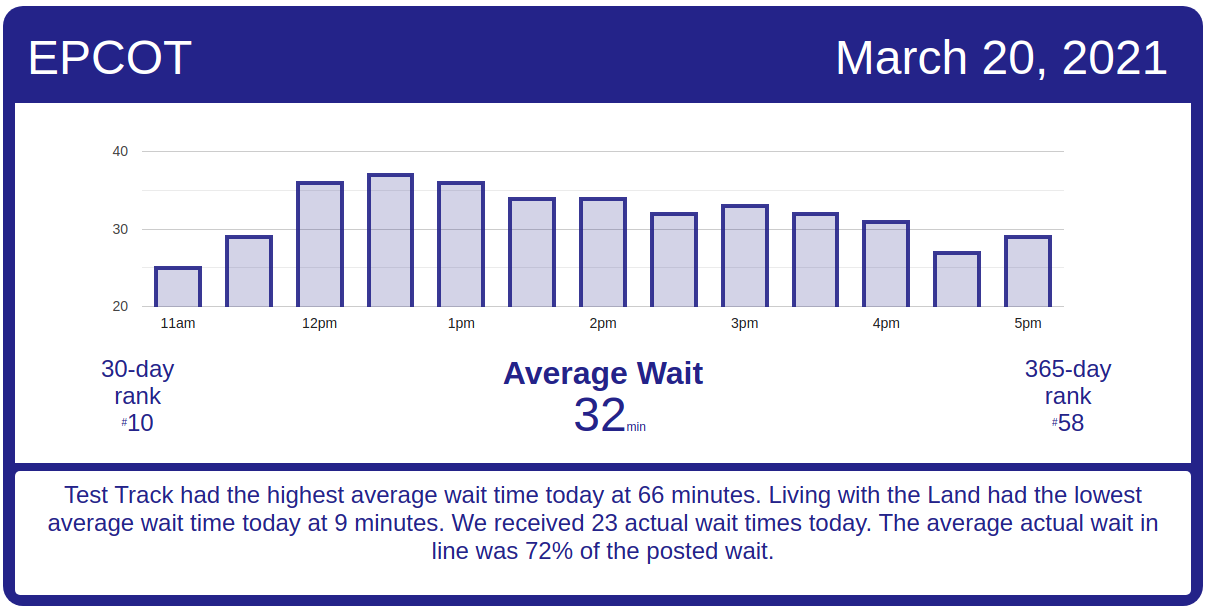
Rise of the Resistance boarding groups for Saturday, March 20, 2021
Muppet*Vision 3D
Average Posted Wait
31
7-Day Rank
#4
30-Day Rank
#16
365-Day Rank
#39
Rock ‘n’ Roller Coaster Starring Aerosmith
Average Posted Wait
43
Actual Waits Were
76%
7-Day Rank
#4
30-Day Rank
#16
365-Day Rank
#126
Star Tours: The Adventures Continue
Average Posted Wait
36
7-Day Rank
#2
30-Day Rank
#15
365-Day Rank
#47
The Twilight Zone Tower of Terror
Average Posted Wait
66
7-Day Rank
#1
30-Day Rank
#12
365-Day Rank
#36
Toy Story Mania!
Average Posted Wait
33
Actual Waits Were
70%
7-Day Rank
#3
30-Day Rank
#16
365-Day Rank
#48
Walt Disney Presents
Average Posted Wait
20
7-Day Rank
#1
30-Day Rank
#1
365-Day Rank
#1
Slinky Dog Dash
Average Posted Wait
76
Actual Waits Were
83%
7-Day Rank
#1
30-Day Rank
#3
365-Day Rank
#18
Alien Swirling Saucers
Average Posted Wait
34
7-Day Rank
#1
30-Day Rank
#7
365-Day Rank
#16
Mickey & Minnie’s Runaway Railway
Average Posted Wait
41
Actual Waits Were
86%
7-Day Rank
#3
30-Day Rank
#24
365-Day Rank
#218
Millennium Falcon: Smugglers Run
Average Posted Wait
68
7-Day Rank
#1
30-Day Rank
#2
365-Day Rank
#27

EPCOT Wait Times

Frozen Ever After had an average wait time today of 45 minutes. Its 7-day average is 54 minutes, so today ranks #6 for this week. Its 30-day average is 38 minutes, so today ranks #8 for the past month. Its 365-day average is 45 minutes, so today ranks #104 for the past year. We received 9 actual wait times today, and the actual wait averaged 72% of the posted wait time.

EPCOT wait times for Saturday, March 20, 2021
Gran Fiesta Tour Starring The Three Caballeros
Average Posted Wait
9
7-Day Rank
#3
30-Day Rank
#13
365-Day Rank
#127
Journey Into Imagination With Figment
Average Posted Wait
16
7-Day Rank
#5
30-Day Rank
#9
365-Day Rank
#74
Living with the Land
Average Posted Wait
9
7-Day Rank
#5
30-Day Rank
#13
365-Day Rank
#173
Mission: SPACE Orange
Average Posted Wait
49
7-Day Rank
#4
30-Day Rank
#4
365-Day Rank
#19
Soarin’
Average Posted Wait
57
7-Day Rank
#5
30-Day Rank
#6
365-Day Rank
#25
Spaceship Earth
Average Posted Wait
28
7-Day Rank
#5
30-Day Rank
#11
365-Day Rank
#42
Test Track
Average Posted Wait
66
7-Day Rank
#6
30-Day Rank
#10
365-Day Rank
#62
The Seas with Nemo & Friends
Average Posted Wait
16
7-Day Rank
#5
30-Day Rank
#6
365-Day Rank
#31
Frozen Ever After
Average Posted Wait
45
Actual Waits Were
72%
7-Day Rank
#6
30-Day Rank
#8
365-Day Rank
#104

The post Moderate Crowds – Disney World Wait Times for Saturday, March 20, 2021 appeared first on TouringPlans.com Blog.