Short Lines Start Month – Disney World Wait Times for Monday, March 1, 2021

Wait times were low across most of Walt Disney World today, with EPCOT’s average posted wait just 12 minutes for the day. And average posted waits at the Animal Kingdom were not more than 20 minutes.

We’ve got 147 actual wait times so far today from our fabulous Lines community.  We counted 488 of 500 guests (98%) in Hollywood Studios wearing masks according to Disney’s guidelines.  Let’s do the rest of the numbers!

Magic Kingdom Wait Times

Big Thunder Mountain Railroad had an average wait time today of 53 minutes. Its 7-day average is 50 minutes, so today ranks #2 for this week. Its 30-day average is 50 minutes, so today ranks #11 for the past month. Its 365-day average is 44 minutes, so today ranks #61 for the past year. We received 8 actual wait times today, and the actual wait averaged 57% of the posted wait time.

Magic Kingdom wait times for Monday, March 1, 2021
Astro Orbiter
Average Posted Wait
34
7-Day Rank
#5
30-Day Rank
#23
365-Day Rank
#105
Big Thunder Mountain Railroad
Average Posted Wait
53
Actual Waits Were
57%
7-Day Rank
#2
30-Day Rank
#11
365-Day Rank
#61
Buzz Lightyear’s Space Ranger Spin
Average Posted Wait
39
7-Day Rank
#4
30-Day Rank
#15
365-Day Rank
#61
Prince Charming Regal Carrousel
Average Posted Wait
45
7-Day Rank
#1
30-Day Rank
#1
365-Day Rank
#1
Dumbo the Flying Elephant
Average Posted Wait
20
7-Day Rank
#3
30-Day Rank
#14
365-Day Rank
#42
“it’s a small world”
Average Posted Wait
45
7-Day Rank
#2
30-Day Rank
#13
365-Day Rank
#39
Jungle Cruise
Average Posted Wait
43
7-Day Rank
#3
30-Day Rank
#17
365-Day Rank
#91
Mickey’s PhilharMagic
Average Posted Wait
32
7-Day Rank
#2
30-Day Rank
#5
365-Day Rank
#23
Peter Pan’s Flight
Average Posted Wait
41
Actual Waits Were
84%
7-Day Rank
#3
30-Day Rank
#12
365-Day Rank
#61
Pirates of the Caribbean
Average Posted Wait
55
Actual Waits Were
88%
7-Day Rank
#4
30-Day Rank
#14
365-Day Rank
#42
Space Mountain
Average Posted Wait
38
7-Day Rank
#4
30-Day Rank
#16
365-Day Rank
#116
Splash Mountain
Average Posted Wait
59
Actual Waits Were
64%
7-Day Rank
#5
30-Day Rank
#16
365-Day Rank
#76
The Barnstormer
Average Posted Wait
23
7-Day Rank
#4
30-Day Rank
#18
365-Day Rank
#87
The Haunted Mansion
Average Posted Wait
26
Actual Waits Were
81%
7-Day Rank
#4
30-Day Rank
#16
365-Day Rank
#137
The Magic Carpets of Aladdin
Average Posted Wait
17
7-Day Rank
#4
30-Day Rank
#16
365-Day Rank
#56
The Many Adventures of Winnie the Pooh
Average Posted Wait
26
Actual Waits Were
79%
7-Day Rank
#5
30-Day Rank
#18
365-Day Rank
#91
Tomorrowland Speedway
Average Posted Wait
18
7-Day Rank
#2
30-Day Rank
#11
365-Day Rank
#87
Seven Dwarfs Mine Train
Average Posted Wait
61
Actual Waits Were
60%
7-Day Rank
#5
30-Day Rank
#18
365-Day Rank
#102
Under the Sea ~ Journey of the Little Mermaid
Average Posted Wait
28
7-Day Rank
#2
30-Day Rank
#8
365-Day Rank
#49

Animal Kingdom Wait Times

Kilimanjaro Safaris had an average wait time today of 15 minutes. Its 7-day average is 30 minutes, so today ranks #6 for this week. Its 30-day average is 26 minutes, so today ranks #23 for the past month. Its 365-day average is 24 minutes, so today ranks #164 for the past year. We received 4 actual wait times today, and the actual wait averaged 53% of the posted wait time.

Animal Kingdom wait times for Monday, March 1, 2021
DINOSAUR
Average Posted Wait
22
7-Day Rank
#6
30-Day Rank
#23
365-Day Rank
#146
Expedition Everest – Legend of the Forbidden Mountain
Average Posted Wait
9
Actual Waits Were
88%
7-Day Rank
#5
30-Day Rank
#24
365-Day Rank
#232
Kilimanjaro Safaris
Average Posted Wait
15
Actual Waits Were
53%
7-Day Rank
#6
30-Day Rank
#23
365-Day Rank
#164
It’s Tough to Be a Bug!
Average Posted Wait
15
7-Day Rank
#6
30-Day Rank
#18
365-Day Rank
#87
TriceraTop Spin
Average Posted Wait
5
7-Day Rank
#3
30-Day Rank
#10
365-Day Rank
#66
Na’vi River Journey
Average Posted Wait
50
7-Day Rank
#6
30-Day Rank
#19
365-Day Rank
#93
Avatar Flight of Passage
Average Posted Wait
25
Actual Waits Were
65%
7-Day Rank
#6
30-Day Rank
#23
365-Day Rank
#181

Hollywood Studios Wait Times

Rock ‘n’ Roller Coaster Starring The Cast of Grease had an average wait time today of 34 minutes. Its 7-day average is 42 minutes, so today ranks #6 for this week. Its 30-day average is 40 minutes, so today ranks #21 for the past month. Its 365-day average is 43 minutes, so today ranks #176 for the past year. We received 10 actual wait times today, and the actual wait averaged 61% of the posted wait time.

Hollywood Studios wait times for Monday, March 1, 2021

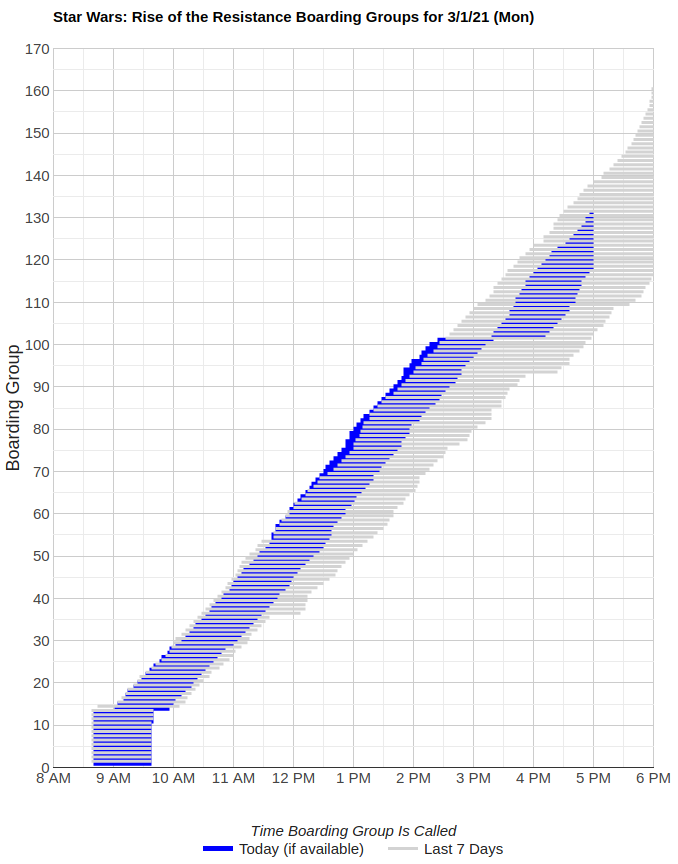
Rise of the Resistance had a solid day of operations until around 2:30 p.m.  Rise of the Resistance started calling boarding groups around 8:45 a.m., and ran at a quick pace for the next six hours.  Boarding for Rise paused at group 102 around 2:30 p.m., for about 50 minutes.  Rise resumed calling boarding groups around 3:20 p.m., and ROTR was up to boarding group 131 as I write this.   They may get to boarding group 150 today with a little bit of luck.

Rise of the Resistance boarding groups for Monday, March 1, 2021
Muppet*Vision 3D
Average Posted Wait
33
7-Day Rank
#3
30-Day Rank
#5
365-Day Rank
#15
Rock ‘n’ Roller Coaster Starring Aerosmith
Average Posted Wait
34
Actual Waits Were
61%
7-Day Rank
#6
30-Day Rank
#21
365-Day Rank
#176
Star Tours: The Adventures Continue
Average Posted Wait
29
Actual Waits Were
50%
7-Day Rank
#5
30-Day Rank
#21
365-Day Rank
#99
The Twilight Zone Tower of Terror
Average Posted Wait
53
7-Day Rank
#6
30-Day Rank
#22
365-Day Rank
#88
Toy Story Mania!
Average Posted Wait
28
Actual Waits Were
60%
7-Day Rank
#6
30-Day Rank
#20
365-Day Rank
#97
Walt Disney Presents
Average Posted Wait
26
7-Day Rank
#1
30-Day Rank
#1
365-Day Rank
#1
Rock ‘n’ Roller Coaster Single Rider Line
Average Posted Wait
30
7-Day Rank
#1
30-Day Rank
#1
365-Day Rank
#1
Slinky Dog Dash
Average Posted Wait
59
Actual Waits Were
49%
7-Day Rank
#5
30-Day Rank
#18
365-Day Rank
#132
Alien Swirling Saucers
Average Posted Wait
22
7-Day Rank
#6
30-Day Rank
#24
365-Day Rank
#162
Mickey & Minnie’s Runaway Railway
Average Posted Wait
47
Actual Waits Were
95%
7-Day Rank
#3
30-Day Rank
#14
365-Day Rank
#165
Millennium Falcon: Smugglers Run
Average Posted Wait
52
Actual Waits Were
127%
7-Day Rank
#6
30-Day Rank
#20
365-Day Rank
#133

EPCOT Wait Times

Test Track had an average wait time today of 24 minutes. Its 7-day average is 44 minutes, so today ranks #6 for this week. Its 30-day average is 55 minutes, so today ranks #29 for the past month. Its 365-day average is 54 minutes, so today ranks #244 for the past year. We received 6 actual wait times today, and the actual wait averaged 45% of the posted wait time.

EPCOT wait times for Monday, March 1, 2021
Gran Fiesta Tour Starring The Three Caballeros
Average Posted Wait
10
7-Day Rank
#2
30-Day Rank
#11
365-Day Rank
#110
Journey Into Imagination With Figment
Average Posted Wait
6
7-Day Rank
#6
30-Day Rank
#29
365-Day Rank
#187
Living with the Land
Average Posted Wait
5
7-Day Rank
#1
30-Day Rank
#20
365-Day Rank
#234
Mission: SPACE Orange
Average Posted Wait
16
7-Day Rank
#6
30-Day Rank
#27
365-Day Rank
#186
Soarin’
Average Posted Wait
19
7-Day Rank
#6
30-Day Rank
#23
365-Day Rank
#176
Spaceship Earth
Average Posted Wait
6
7-Day Rank
#6
30-Day Rank
#29
365-Day Rank
#223
Test Track
Average Posted Wait
24
Actual Waits Were
45%
7-Day Rank
#6
30-Day Rank
#29
365-Day Rank
#244
The Seas with Nemo & Friends
Average Posted Wait
9
7-Day Rank
#1
30-Day Rank
#12
365-Day Rank
#130
Frozen Ever After
Average Posted Wait
17
7-Day Rank
#6
30-Day Rank
#28
365-Day Rank
#237

The post Short Lines Start Month – Disney World Wait Times for Monday, March 1, 2021 appeared first on TouringPlans.com Blog.