

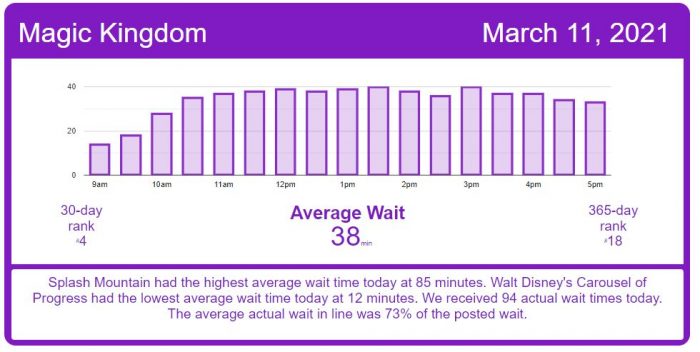
Spring Break crowds continue at each of the four Walt Disney World theme parks. Each park, but Hollywood Studios, had average posted wait times that ranked near the top of the past 30 days. At Magic Kingdom we observed 481 out of 500 guests (96%) wearing their masks in accordance with Disney’s guidelines. We received 231 actual wait times in our Lines app from our awesome Liners!
Magic Kingdom Wait Times
Big Thunder Mountain Railroad had an average wait time today of 42 minutes. Its 7-day average is 43 minutes, so today ranks #4 for this week. Its 30-day average is 52 minutes, so today ranks #24 for the past month. We received 15 actual wait times today, and the actual wait averaged 40% of the posted wait time, average actual wait was 17 minutes. Looks like loading every row is paying off!
Buzz Lightyear’s Space Ranger Spin had an average wait time today of 45 minutes. Its 7-day average is 45 minutes, so today ranks #2 for this week. Its 30-day average is 42 minutes, so today ranks #12 for the past month. Its 365-day average is 28 minutes, so today ranks #22 for the past year. We received 4 actual wait times today, and the actual wait averaged 84% of the posted wait time.
Dumbo the Flying Elephant had an average wait time today of 24 minutes. Its 7-day average is 24 minutes, so today ranks #4 for this week. Its 30-day average is 21 minutes, so today ranks #11 for the past month. Its 365-day average is 13 minutes, so today ranks #22 for the past year.
“it’s a small world” had an average wait time today of 48 minutes. Its 7-day average is 48 minutes, so today ranks #2 for this week. Its 30-day average is 46 minutes, so today ranks #13 for the past month. Its 365-day average is 34 minutes, so today ranks #26 for the past year. We received 4 actual wait times today, and the actual wait averaged 160% of the posted wait time.
Peter Pan’s Flight had an average wait time today of 45 minutes. Its 7-day average is 46 minutes, so today ranks #4 for this week. Its 30-day average is 41 minutes, so today ranks #10 for the past month. Its 365-day average is 33 minutes, so today ranks #32 for the past year. We received 5 actual wait times today, and the actual wait averaged 89% of the posted wait time.
Space Mountain had an average wait time today of 51 minutes. Its 7-day average is 52 minutes, so today ranks #4 for this week. Its 30-day average is 48 minutes, so today ranks #12 for the past month. Its 365-day average is 36 minutes, so today ranks #57 for the past year. We received 4 actual wait times today, and the actual wait averaged 69% of the posted wait time.
Splash Mountain had an average wait time today of 85 minutes. Its 7-day average is 72 minutes, so today ranks #1 for this week. Its 30-day average is 68 minutes, so today ranks #3 for the past month. We received 8 actual wait times today, and the actual wait averaged 78% of the posted wait time, so the average actual wait was 66 minutes.
The Haunted Mansion had an average wait time today of 32 minutes. Its 7-day average is 33 minutes, so today ranks #4 for this week. Its 30-day average is 29 minutes, so today ranks #8 for the past month. Its 365-day average is 28 minutes, so today ranks #80 for the past year. We received 6 actual wait times today, and the actual wait averaged 64% of the posted wait time.
Seven Dwarfs Mine Train had an average wait time today of 65 minutes. Its 7-day average is 64 minutes, so today ranks #3 for this week. Its 30-day average is 70 minutes, so today ranks #17 for the past month. Its 365-day average is 57 minutes, so today ranks #84 for the past year.
Under the Sea ~ Journey of the Little Mermaid had an average wait time today of 26 minutes. Its 7-day average is 28 minutes, so today ranks #5 for this week. Its 30-day average is 26 minutes, so today ranks #19 for the past month. Its 365-day average is 20 minutes, so today ranks #80 for the past year. We received 8 actual wait times today, and the actual wait averaged 49% of the posted wait time.
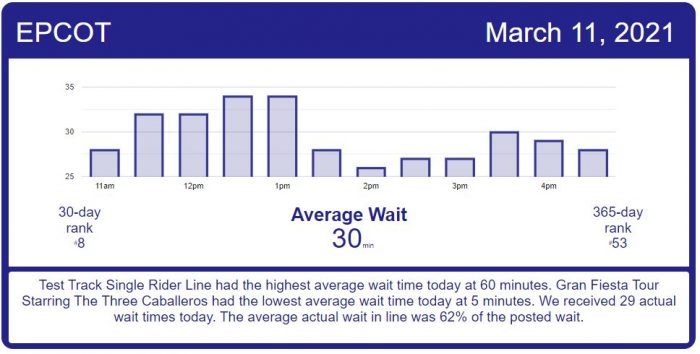
EPCOT Wait Times
Journey Into Imagination With Figment had an average wait time today of 16 minutes. Its 7-day average is 13 minutes, so today ranks #1 for this week. Its 30-day average is 15 minutes, so today ranks #10 for the past month. Its 365-day average is 13 minutes, so today ranks #70 for the past year.
Living with the Land had an average wait time today of 7 minutes. Its 7-day average is 9 minutes, so today ranks #5 for this week. Its 30-day average is 9 minutes, so today ranks #17 for the past month. Its 365-day average is 11 minutes, so today ranks #201 for the past year.
Mission: SPACE Orange had an average wait time today of 43 minutes. Its 7-day average is 37 minutes, so today ranks #2 for this week. Its 30-day average is 33 minutes, so today ranks #4 for the past month. Its 365-day average is 27 minutes, so today ranks #24 for the past year.
Soarin’ had an average wait time today of 53 minutes. Its 7-day average is 47 minutes, so today ranks #2 for this week. Its 30-day average is 42 minutes, so today ranks #8 for the past month. Its 365-day average is 32 minutes, so today ranks #31 for the past year.
Spaceship Earth had an average wait time today of 27 minutes. Its 7-day average is 25 minutes, so today ranks #2 for this week. Its 30-day average is 23 minutes, so today ranks #10 for the past month. We received 7 actual wait times today, and the actual wait averaged 76% of the posted wait time, so the average actual wait was 20 minutes.
Test Track had an average wait time today of 57 minutes. Its 7-day average is 53 minutes, so today ranks #2 for this week. Its 30-day average is 56 minutes, so today ranks #12 for the past month. We received 9 actual wait times today, and the actual wait averaged 58% of the posted wait time, so the average actual wait was 33 minutes.
The Seas with Nemo & Friends had an average wait time today of 16 minutes. Its 7-day average is 13 minutes, so today ranks #1 for this week. Its 30-day average is 11 minutes, so today ranks #3 for the past month. Its 365-day average is 11 minutes, so today ranks #24 for the past year.
Frozen Ever After had an average wait time today of 43 minutes. Its 7-day average is 40 minutes, so today ranks #3 for this week. Its 30-day average is 34 minutes, so today ranks #8 for the past month. Its 365-day average is 45 minutes, so today ranks #115 for the past year.
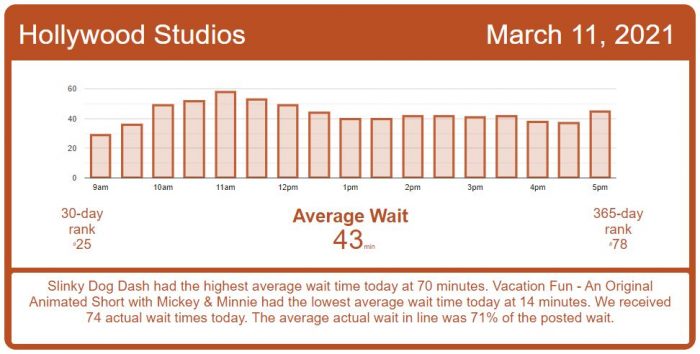
Disney’s Hollywood Studios Wait Times
Rock ‘n’ Roller Coaster Starring Jimmy Buffett (yes I’ve used this one before, but he just announced live shows in 2022 so I’m excited, ok?), had an average wait time today of 46 minutes. Its 7-day average is 49 minutes, so today ranks #4 for this week. Its 30-day average is 45 minutes, so today ranks #14 for the past month. Its 365-day average is 41 minutes, so today ranks #107 for the past year. We received 8 actual wait times today, and the actual wait averaged 64% of the posted wait time.
The Twilight Zone Tower of Terror had an average wait time today of 69 minutes. Its 7-day average is 74 minutes, so today ranks #2 for this week. Its 30-day average is 67 minutes, so today ranks #8 for the past month. Its 365-day average is 50 minutes, so today ranks #25 for the past year.
Toy Story Mania! had an average wait time today of 36 minutes. Its 7-day average is 37 minutes, so today ranks #3 for this week. Its 30-day average is 35 minutes, so today ranks #12 for the past month. We received 21 actual wait times today, and the actual wait averaged 61% of the posted wait time, so the average actual wait was 22 minutes.
Slinky Dog Dash had an average wait time today of 70 minutes. Its 7-day average is 71 minutes, so today ranks #3 for this week. Its 30-day average is 67 minutes, so today ranks #10 for the past month. We received 13 actual wait times today, and the actual wait averaged 71% of the posted wait time, so the average actual wait was 50 minutes.
Mickey & Minnie’s Runaway Railway had an average wait time today of 46 minutes. Its 7-day average is 50 minutes, so today ranks #4 for this week. Its 30-day average is 49 minutes, so today ranks #21 for the past month. Its 365-day average is 58 minutes, so today ranks #176 for the past year. We received 9 actual wait times today, and the actual wait averaged 85% of the posted wait time.
Millennium Falcon: Smugglers Run had an average wait time today of 64 minutes. Its 7-day average is 65 minutes, so today ranks #4 for this week. Its 30-day average is 62 minutes, so today ranks #14 for the past month. Its 365-day average is 52 minutes, so today ranks #56 for the past year.
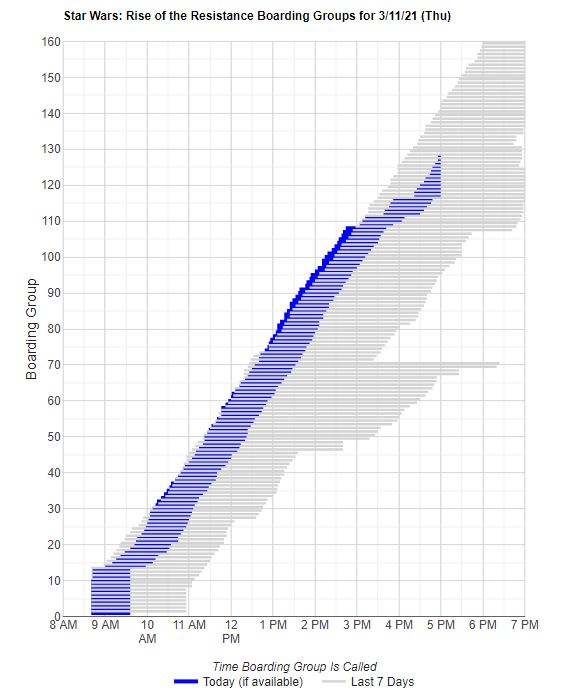
Rise of the Resistance started off doing pretty great, and boarding groups were even above pace of the past 7 days, but things have gotten bumpy this afternoon.
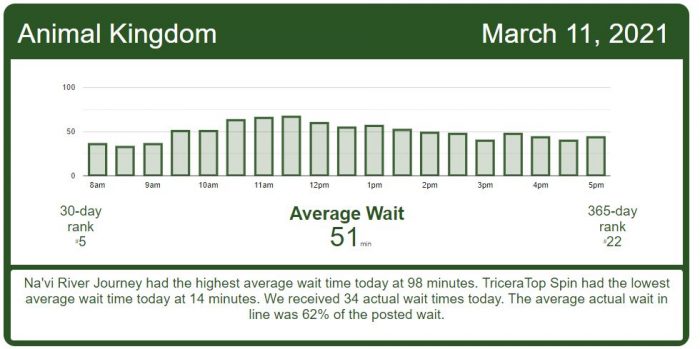
Disney’s Animal Kingdom Wait Times
DINOSAUR had an average wait time today of 59 minutes. Its 7-day average is 53 minutes, so today ranks #3 for this week. Its 30-day average is 46 minutes, so today ranks #5 for the past month. Its 365-day average is 30 minutes, so today ranks #22 for the past year.
Expedition Everest – Legend of the Forbidden Mountain had an average wait time today of 26 minutes. Its 7-day average is 24 minutes, so today ranks #3 for this week. Its 30-day average is 22 minutes, so today ranks #10 for the past month. Its 365-day average is 26 minutes, so today ranks #100 for the past year. We received 15 actual wait times today, and the actual wait averaged 53% of the posted wait time.
Kilimanjaro Safaris had an average wait time today of 37 minutes. Its 7-day average is 33 minutes, so today ranks #2 for this week. Its 30-day average is 30 minutes, so today ranks #8 for the past month. We received 9 actual wait times today, and the actual wait averaged 45% of the posted wait time, so the average actual wait was 17 minutes.
Na’vi River Journey had an average wait time today of 98 minutes. Its 7-day average is 83 minutes, so today ranks #2 for this week. Its 30-day average is 71 minutes, so today ranks #2 for the past month. Its 365-day average is 45 minutes, so today ranks #2 for the past year.
Avatar Flight of Passage had an average wait time today of 78 minutes. Its 7-day average is 67 minutes, so today ranks #2 for this week. Its 30-day average is 58 minutes, so today ranks #5 for the past month. Its 365-day average is 47 minutes, so today ranks #36 for the past year. We received 5 actual wait times today, and the actual wait averaged 72% of the posted wait time.
The post Spring Break Crowds Continue – Disney World Wait Times for Thursday, March 11, 2021 appeared first on TouringPlans.com Blog.