Wait Times Still Moderate – Disney World Lines for Sunday, March 14, 2021

Wait times at the Magic Kingdom, Animal Kingdom, and Hollywood Studios were moderate today, once again (probably) due to the expanded ride capacity at key rides at those parks.  We know Spring Break in full force because we’ve already got over 275 actual wait times from our fabulous Lines community. Let’s do the rest of the numbers!

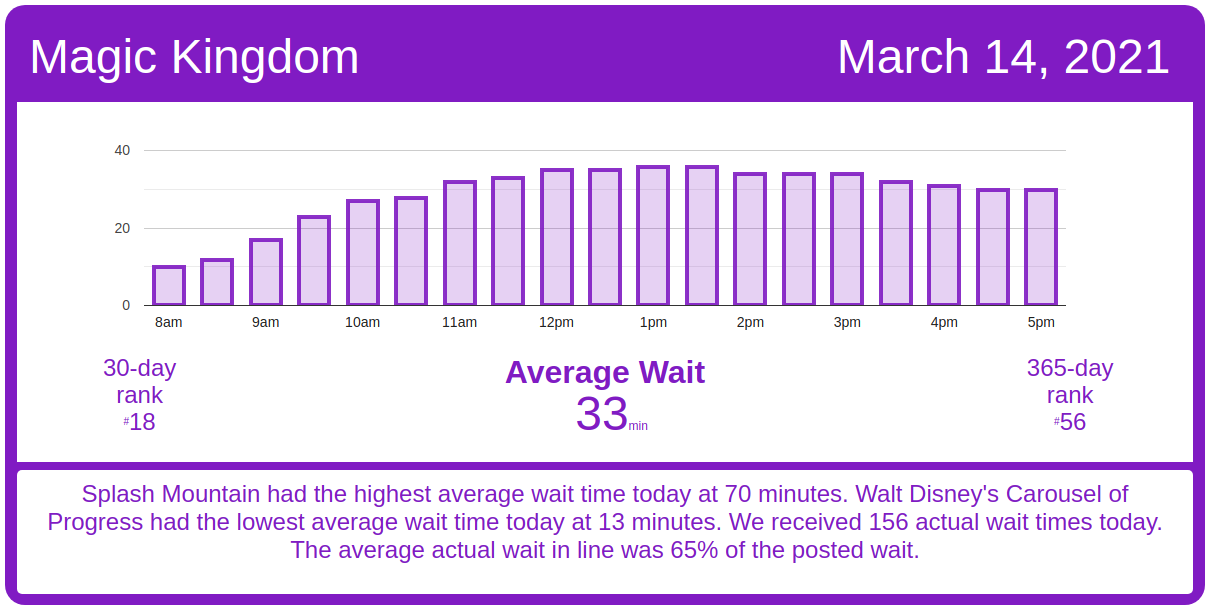
Magic Kingdom Wait Times

Splash Mountain had an average wait time today of 70 minutes. Its 7-day average is 80 minutes, so today ranks #5 for this week. Its 30-day average is 71 minutes, so today ranks #16 for the past month.  We received 14 actual wait times today, and the actual wait averaged 76% of the posted wait time.

Magic Kingdom wait times for Sunday, March 14, 2021
Astro Orbiter
Average Posted Wait
36
7-Day Rank
#6
30-Day Rank
#26
365-Day Rank
#87
Big Thunder Mountain Railroad
Average Posted Wait
36
Actual Waits Were
34%
7-Day Rank
#6
30-Day Rank
#27
365-Day Rank
#179
Buzz Lightyear’s Space Ranger Spin
Average Posted Wait
39
Actual Waits Were
77%
7-Day Rank
#6
30-Day Rank
#24
365-Day Rank
#63
Prince Charming Regal Carrousel
Average Posted Wait
37
7-Day Rank
#1
30-Day Rank
#1
365-Day Rank
#1
Dumbo the Flying Elephant
Average Posted Wait
20
7-Day Rank
#4
30-Day Rank
#21
365-Day Rank
#43
“it’s a small world”
Average Posted Wait
43
Actual Waits Were
106%
7-Day Rank
#6
30-Day Rank
#25
365-Day Rank
#64
Jungle Cruise
Average Posted Wait
45
Actual Waits Were
65%
7-Day Rank
#5
30-Day Rank
#18
365-Day Rank
#67
Mad Tea Party
Average Posted Wait
15
Actual Waits Were
77%
7-Day Rank
#6
30-Day Rank
#18
365-Day Rank
#69
Mickey’s PhilharMagic
Average Posted Wait
29
7-Day Rank
#6
30-Day Rank
#22
365-Day Rank
#53
Peter Pan’s Flight
Average Posted Wait
40
Actual Waits Were
80%
7-Day Rank
#6
30-Day Rank
#22
365-Day Rank
#61
Pirates of the Caribbean
Average Posted Wait
54
Actual Waits Were
81%
7-Day Rank
#4
30-Day Rank
#22
365-Day Rank
#55
Tom Sawyer Island
Average Posted Wait
40
7-Day Rank
#1
30-Day Rank
#1
365-Day Rank
#1
Space Mountain
Average Posted Wait
51
Actual Waits Were
54%
7-Day Rank
#3
30-Day Rank
#12
365-Day Rank
#54
Splash Mountain
Average Posted Wait
70
Actual Waits Were
76%
7-Day Rank
#5
30-Day Rank
#16
365-Day Rank
#44
The Barnstormer
Average Posted Wait
18
7-Day Rank
#5
30-Day Rank
#27
365-Day Rank
#125
The Haunted Mansion
Average Posted Wait
28
Actual Waits Were
41%
7-Day Rank
#4
30-Day Rank
#17
365-Day Rank
#107
The Magic Carpets of Aladdin
Average Posted Wait
20
Actual Waits Were
40%
7-Day Rank
#3
30-Day Rank
#13
365-Day Rank
#21
The Many Adventures of Winnie the Pooh
Average Posted Wait
25
Actual Waits Were
90%
7-Day Rank
#6
30-Day Rank
#28
365-Day Rank
#99
Tomorrowland Speedway
Average Posted Wait
16
7-Day Rank
#5
30-Day Rank
#23
365-Day Rank
#101
Walt Disney’s Carousel of Progress
Average Posted Wait
13
Actual Waits Were
64%
7-Day Rank
#1
30-Day Rank
#1
365-Day Rank
#1
Seven Dwarfs Mine Train
Average Posted Wait
60
Actual Waits Were
71%
7-Day Rank
#5
30-Day Rank
#25
365-Day Rank
#107
Under the Sea ~ Journey of the Little Mermaid
Average Posted Wait
24
Actual Waits Were
73%
7-Day Rank
#4
30-Day Rank
#21
365-Day Rank
#95

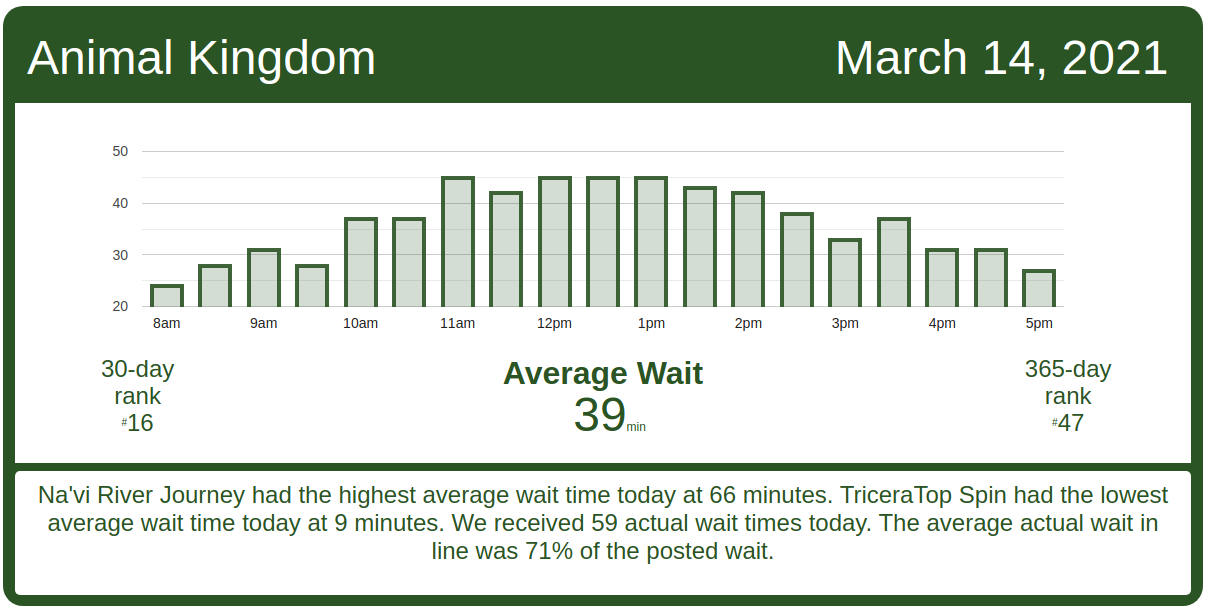
Animal Kingdom Wait Times

DINOSAUR had an average wait time today of 51 minutes. Its 7-day average is 57 minutes, so today ranks #5 for this week. Its 30-day average is 48 minutes, so today ranks #13 for the past month.  We received 8 actual wait times today, and the actual wait averaged 104% of the posted wait time.

Animal Kingdom wait times for Sunday, March 14, 2021
DINOSAUR
Average Posted Wait
51
Actual Waits Were
104%
7-Day Rank
#5
30-Day Rank
#13
365-Day Rank
#37
Expedition Everest – Legend of the Forbidden Mountain
Average Posted Wait
26
Actual Waits Were
77%
7-Day Rank
#3
30-Day Rank
#11
365-Day Rank
#97
Kilimanjaro Safaris
Average Posted Wait
28
Actual Waits Were
43%
7-Day Rank
#5
30-Day Rank
#17
365-Day Rank
#54
It’s Tough to Be a Bug!
Average Posted Wait
28
7-Day Rank
#2
30-Day Rank
#10
365-Day Rank
#23
TriceraTop Spin
Average Posted Wait
9
7-Day Rank
#5
30-Day Rank
#13
365-Day Rank
#32
Na’vi River Journey
Average Posted Wait
66
Actual Waits Were
72%
7-Day Rank
#6
30-Day Rank
#20
365-Day Rank
#38
Avatar Flight of Passage
Average Posted Wait
65
Actual Waits Were
69%
7-Day Rank
#4
30-Day Rank
#11
365-Day Rank
#62

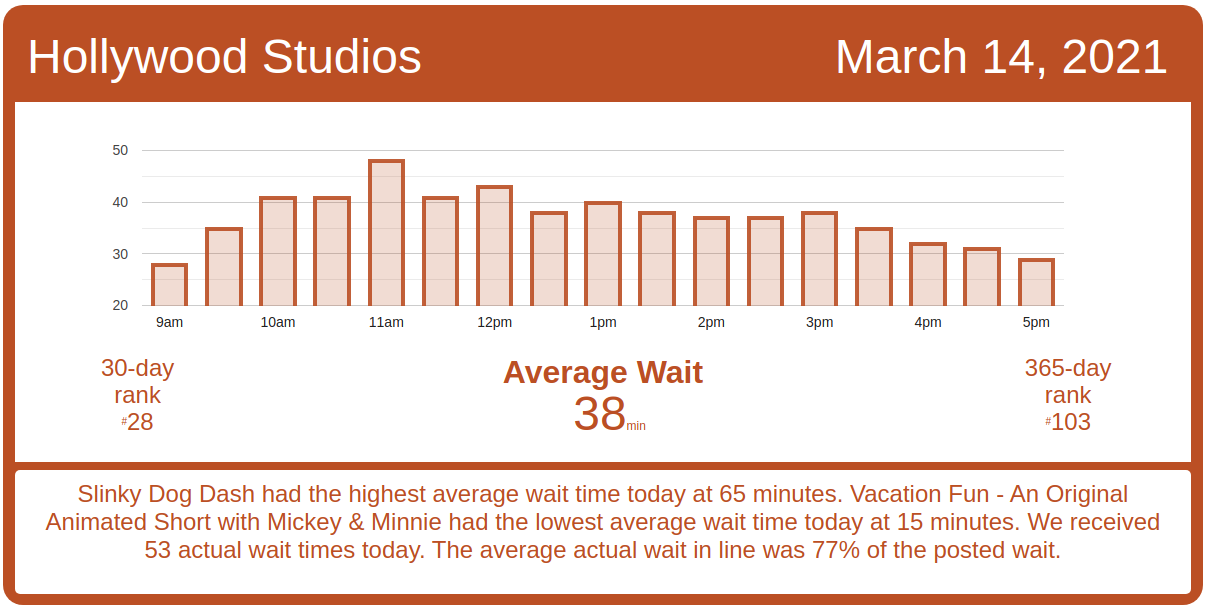
Hollywood Studios Wait Times

Toy Story Mania! had an average wait time today of 35 minutes. Its 7-day average is 38 minutes, so today ranks #4 for this week. Its 30-day average is 36 minutes, so today ranks #14 for the past month. We received 10 actual wait times today, and the actual wait averaged 84% of the posted wait time.

Hollywood Studios wait times for Sunday, March 14, 2021

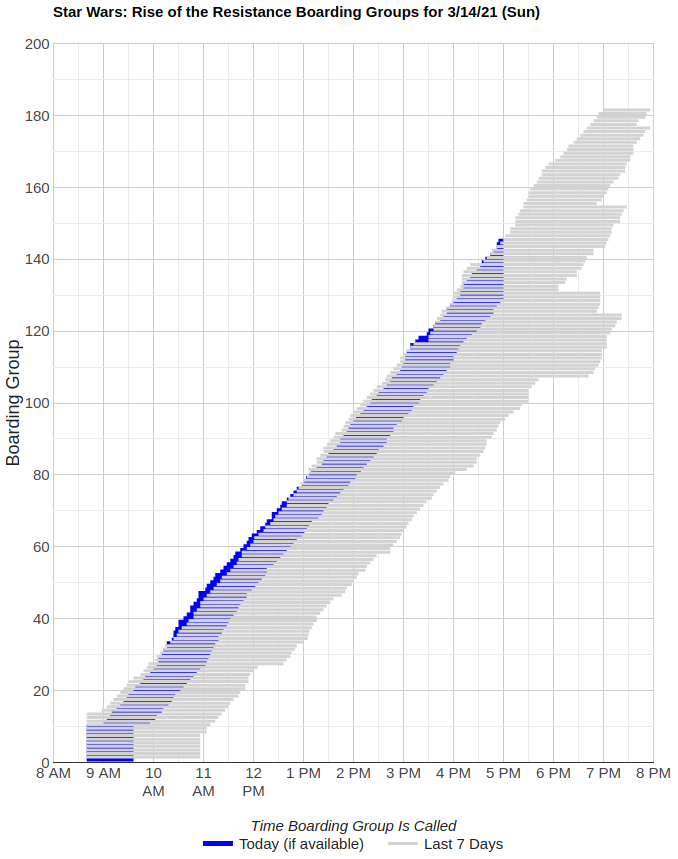
Rise of the Resistance is having another excellent day of operations. Rise of the Resistance started calling boarding groups today at around 8:45 a.m., and has not stopped since.  ROTR is currently at boarding group 145 and should easily hit boarding group 160 today.  Congratulations to the ride ops team.
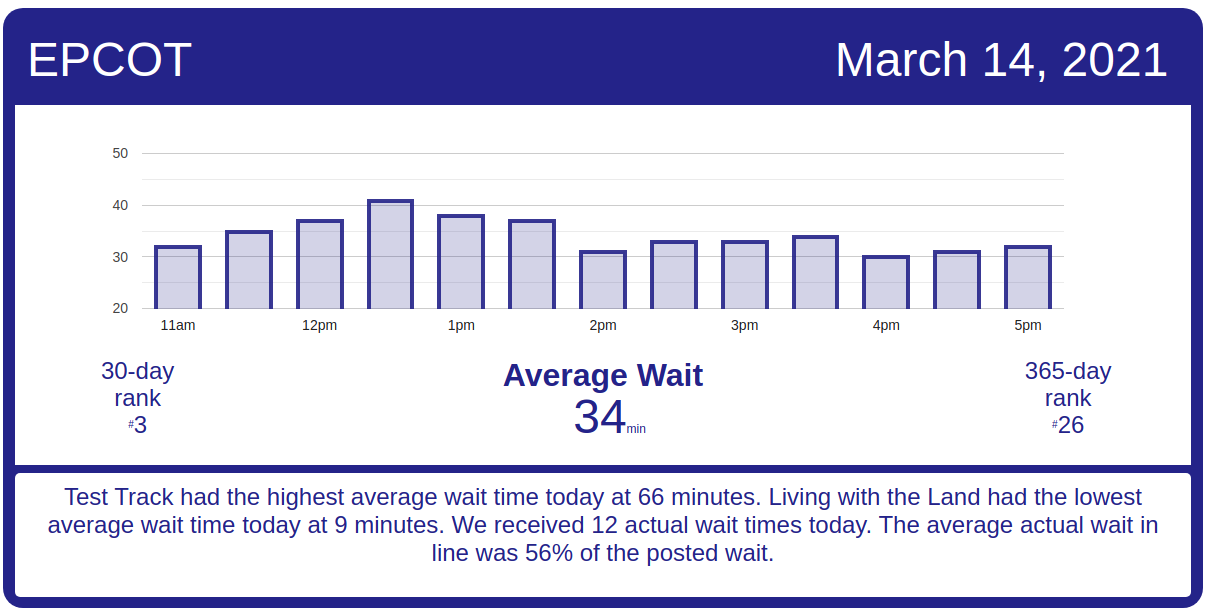
Rise of the Resistance boarding groups for Sunday, March 14, 2021
Muppet*Vision 3D
Average Posted Wait
29
7-Day Rank
#5
30-Day Rank
#22
365-Day Rank
#49
Rock ‘n’ Roller Coaster Starring Aerosmith
Average Posted Wait
49
Actual Waits Were
111%
7-Day Rank
#3
30-Day Rank
#9
365-Day Rank
#73
Star Tours: The Adventures Continue
Average Posted Wait
32
Actual Waits Were
52%
7-Day Rank
#6
30-Day Rank
#24
365-Day Rank
#77
The Twilight Zone Tower of Terror
Average Posted Wait
62
7-Day Rank
#4
30-Day Rank
#22
365-Day Rank
#59
Toy Story Mania!
Average Posted Wait
35
Actual Waits Were
84%
7-Day Rank
#4
30-Day Rank
#14
365-Day Rank
#30
Walt Disney Presents
Average Posted Wait
19
7-Day Rank
#1
30-Day Rank
#1
365-Day Rank
#1
Slinky Dog Dash
Average Posted Wait
65
Actual Waits Were
63%
7-Day Rank
#5
30-Day Rank
#17
365-Day Rank
#93
Alien Swirling Saucers
Average Posted Wait
30
Actual Waits Were
61%
7-Day Rank
#4
30-Day Rank
#19
365-Day Rank
#49
Mickey & Minnie’s Runaway Railway
Average Posted Wait
41
Actual Waits Were
86%
7-Day Rank
#5
30-Day Rank
#28
365-Day Rank
#217
Millennium Falcon: Smugglers Run
Average Posted Wait
61
Actual Waits Were
65%
7-Day Rank
#5
30-Day Rank
#19
365-Day Rank
#73

EPCOT Wait Times

Soarin’ had an average wait time today of 61 minutes. Its 7-day average is 52 minutes, so today ranks #1 for this week. Its 30-day average is 45 minutes, so today ranks #4 for the past month. We received 4 actual wait times today, and the actual wait averaged 46% of the posted wait time.

EPCOT wait times for Sunday, March 14, 2021
Gran Fiesta Tour Starring The Three Caballeros
Average Posted Wait
15
7-Day Rank
#1
30-Day Rank
#2
365-Day Rank
#20
Journey Into Imagination With Figment
Average Posted Wait
22
7-Day Rank
#1
30-Day Rank
#5
365-Day Rank
#34
Living with the Land
Average Posted Wait
9
7-Day Rank
#4
30-Day Rank
#12
365-Day Rank
#169
Mission: SPACE Orange
Average Posted Wait
42
7-Day Rank
#1
30-Day Rank
#4
365-Day Rank
#22
Soarin’
Average Posted Wait
61
Actual Waits Were
46%
7-Day Rank
#1
30-Day Rank
#4
365-Day Rank
#16
Spaceship Earth
Average Posted Wait
30
7-Day Rank
#1
30-Day Rank
#5
365-Day Rank
#23
Test Track
Average Posted Wait
66
7-Day Rank
#1
30-Day Rank
#10
365-Day Rank
#56
The Seas with Nemo & Friends
Average Posted Wait
15
7-Day Rank
#1
30-Day Rank
#5
365-Day Rank
#30
Frozen Ever After
Average Posted Wait
48
7-Day Rank
#1
30-Day Rank
#3
365-Day Rank
#94

The post Wait Times Still Moderate – Disney World Lines for Sunday, March 14, 2021 appeared first on TouringPlans.com Blog.