A Slow Saturday – Disney World Wait Times for April 24, 2021

Today’s average posted wait times were low across Walt Disney World, with no park’s average wait time ranking higher than 22nd (EPCOT) out of the past 30 days. And EPCOT’s posted waits were almost double the actual waits, so crowds there weren’t even as big as the signage was indicating.

We’ve received 224 actual wait times today from our fabulous Lines community! And we’ve got three TouringPlans staff in the Magic Kingdom this afternoon, testing different versions of touring plans to see which work best.  Let’s do the rest of the numbers!

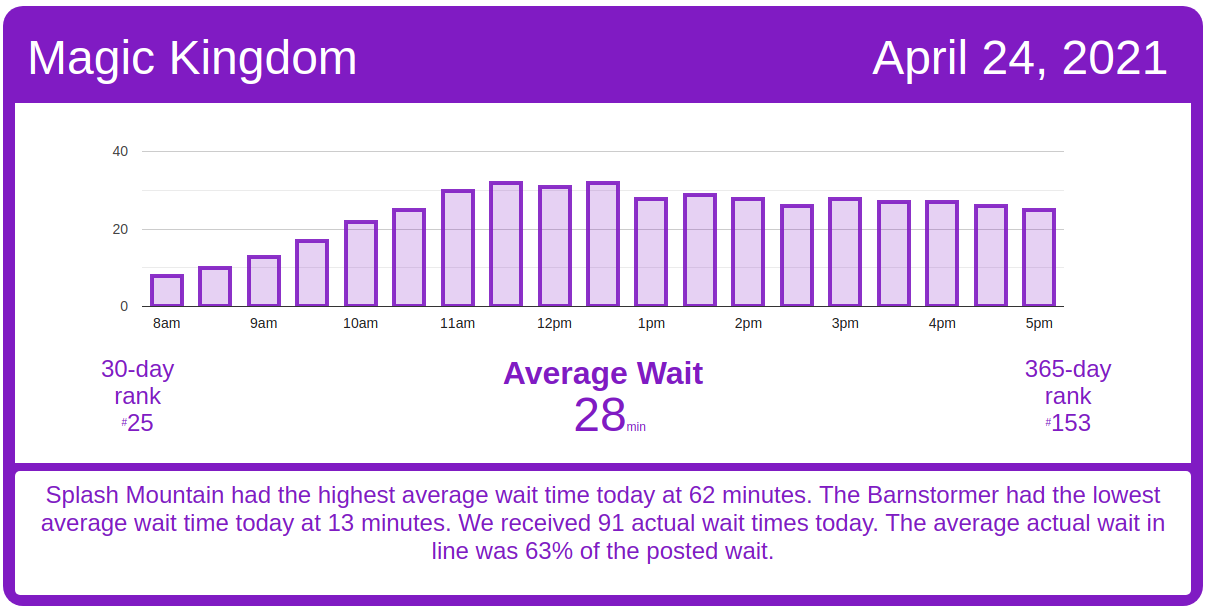
Magic Kingdom Wait Times

Under the Sea ~ Journey of the Little Mermaid had an average wait time today of 26 minutes. Its 7-day average is 25 minutes, so today ranks #1 for this week. Its 30-day average is 22 minutes, so today ranks #4 for the past month. Its 365-day average is 20 minutes, so today ranks #84 for the past year. We received 5 actual wait times today, and the actual wait averaged 26% of the posted wait time.

Magic Kingdom wait times for Saturday, April 24, 2021
Astro Orbiter
Average Posted Wait
43
7-Day Rank
#1
30-Day Rank
#2
365-Day Rank
#35
Big Thunder Mountain Railroad
Average Posted Wait
27
Actual Waits Were
20%
7-Day Rank
#6
30-Day Rank
#27
365-Day Rank
#254
Buzz Lightyear’s Space Ranger Spin
Average Posted Wait
25
Actual Waits Were
61%
7-Day Rank
#6
30-Day Rank
#28
365-Day Rank
#191
Prince Charming Regal Carrousel
Average Posted Wait
24
7-Day Rank
#1
30-Day Rank
#1
365-Day Rank
#1
Country Bear Jamboree
Average Posted Wait
29
7-Day Rank
#1
30-Day Rank
#1
365-Day Rank
#1
Dumbo the Flying Elephant
Average Posted Wait
17
7-Day Rank
#4
30-Day Rank
#24
365-Day Rank
#103
“it’s a small world”
Average Posted Wait
27
7-Day Rank
#6
30-Day Rank
#29
365-Day Rank
#221
Jungle Cruise
Average Posted Wait
38
Actual Waits Were
66%
7-Day Rank
#5
30-Day Rank
#28
365-Day Rank
#179
Mad Tea Party
Average Posted Wait
13
7-Day Rank
#6
30-Day Rank
#26
365-Day Rank
#129
Mickey’s PhilharMagic
Average Posted Wait
30
7-Day Rank
#3
30-Day Rank
#18
365-Day Rank
#58
Peter Pan’s Flight
Average Posted Wait
32
7-Day Rank
#6
30-Day Rank
#29
365-Day Rank
#161
Pirates of the Caribbean
Average Posted Wait
36
Actual Waits Were
67%
7-Day Rank
#6
30-Day Rank
#25
365-Day Rank
#210
Tom Sawyer Island
Average Posted Wait
37
7-Day Rank
#1
30-Day Rank
#1
365-Day Rank
#1
Space Mountain
Average Posted Wait
50
Actual Waits Were
84%
7-Day Rank
#1
30-Day Rank
#11
365-Day Rank
#81
Splash Mountain
Average Posted Wait
62
Actual Waits Were
81%
7-Day Rank
#6
30-Day Rank
#26
365-Day Rank
#104
The Barnstormer
Average Posted Wait
13
7-Day Rank
#6
30-Day Rank
#27
365-Day Rank
#192
The Haunted Mansion
Average Posted Wait
26
Actual Waits Were
75%
7-Day Rank
#4
30-Day Rank
#15
365-Day Rank
#162
The Magic Carpets of Aladdin
Average Posted Wait
17
7-Day Rank
#6
30-Day Rank
#27
365-Day Rank
#92
The Many Adventures of Winnie the Pooh
Average Posted Wait
25
Actual Waits Were
86%
7-Day Rank
#6
30-Day Rank
#26
365-Day Rank
#141
Tomorrowland Speedway
Average Posted Wait
14
7-Day Rank
#5
30-Day Rank
#25
365-Day Rank
#170
Seven Dwarfs Mine Train
Average Posted Wait
48
7-Day Rank
#6
30-Day Rank
#28
365-Day Rank
#201
Under the Sea ~ Journey of the Little Mermaid
Average Posted Wait
26
Actual Waits Were
26%
7-Day Rank
#1
30-Day Rank
#4
365-Day Rank
#84

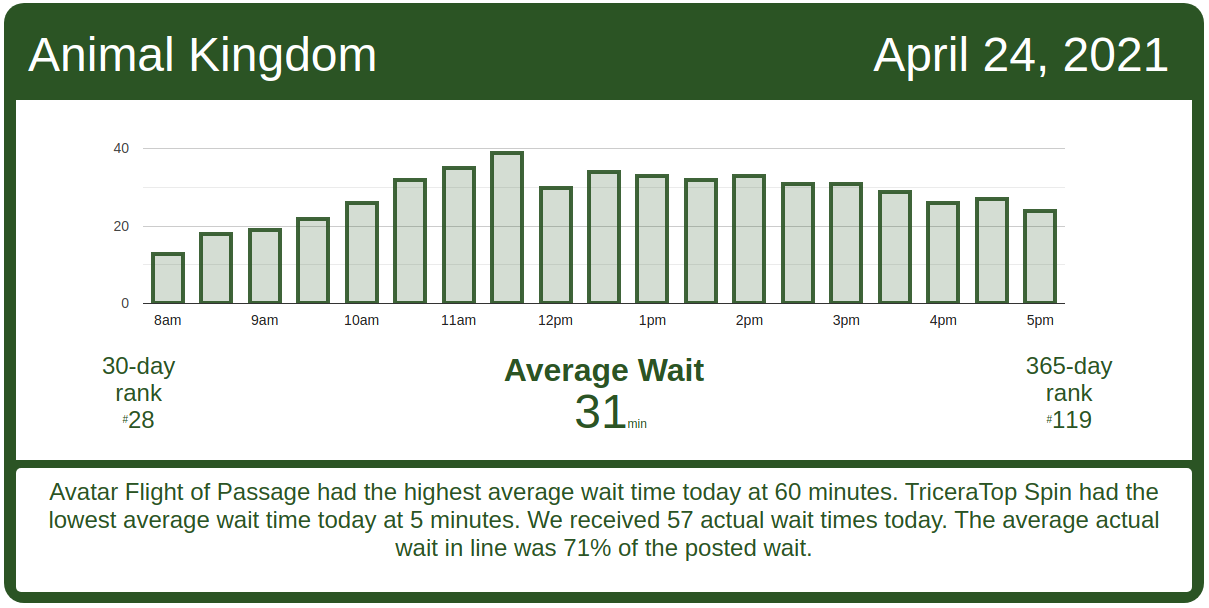
Animal Kingdom Wait Times

Kilimanjaro Safaris had an average wait time today of 28 minutes. Its 7-day average is 48 minutes, so today ranks #6 for this week. Its 30-day average is 40 minutes, so today ranks #26 for the past month. Its 365-day average is 23 minutes, so today ranks #90 for the past year. We received 13 actual wait times today, and the actual wait averaged 41% of the posted wait time.

Animal Kingdom wait times for Saturday, April 24, 2021
DINOSAUR
Average Posted Wait
42
Actual Waits Were
106%
7-Day Rank
#4
30-Day Rank
#24
365-Day Rank
#105
Expedition Everest – Legend of the Forbidden Mountain
Average Posted Wait
21
Actual Waits Were
60%
7-Day Rank
#5
30-Day Rank
#21
365-Day Rank
#171
Kali River Rapids
Average Posted Wait
30
7-Day Rank
#2
30-Day Rank
#13
365-Day Rank
#38
Kilimanjaro Safaris
Average Posted Wait
28
Actual Waits Were
41%
7-Day Rank
#6
30-Day Rank
#26
365-Day Rank
#90
It’s Tough to Be a Bug!
Average Posted Wait
29
7-Day Rank
#6
30-Day Rank
#20
365-Day Rank
#53
TriceraTop Spin
Average Posted Wait
5
7-Day Rank
#3
30-Day Rank
#22
365-Day Rank
#98
Na’vi River Journey
Average Posted Wait
35
Actual Waits Were
78%
7-Day Rank
#5
30-Day Rank
#26
365-Day Rank
#216
Avatar Flight of Passage
Average Posted Wait
60
Actual Waits Were
76%
7-Day Rank
#1
30-Day Rank
#19
365-Day Rank
#105

Hollywood Studios Wait Times

Millennium Falcon: Smugglers Run had an average wait time today of 46 minutes. Its 7-day average is 50 minutes, so today ranks #5 for this week. Its 30-day average is 56 minutes, so today ranks #29 for the past month. Its 365-day average is 53 minutes, so today ranks #204 for the past year. We received 4 actual wait times today, and the actual wait averaged 88% of the posted wait time.

Hollywood Studios wait times for Saturday, April 24, 2021

Rise of the Resistance is having a pretty good run today, after getting a late start. Rise of the Resistance started calling boarding groups at 9:15 a.m. today, about 45 minutes later than normal.  But Rise has only had two small periods of downtime today (one around 11 a.m. at boarding group 37, and another for 15 minutes around 3:10 p.m. at boarding group 105).  As I write this, ROTR is on pace to call around 170 boarding groups for the day.

Rise of the Resistance boarding groups for Saturday, April 24, 2021
Muppet*Vision 3D
Average Posted Wait
28
7-Day Rank
#6
30-Day Rank
#28
365-Day Rank
#95
Rock ‘n’ Roller Coaster Starring Aerosmith
Average Posted Wait
39
Actual Waits Were
73%
7-Day Rank
#4
30-Day Rank
#20
365-Day Rank
#173
Star Tours: The Adventures Continue
Average Posted Wait
29
Actual Waits Were
85%
7-Day Rank
#4
30-Day Rank
#27
365-Day Rank
#151
The Twilight Zone Tower of Terror
Average Posted Wait
51
7-Day Rank
#5
30-Day Rank
#25
365-Day Rank
#139
Toy Story Mania!
Average Posted Wait
28
Actual Waits Were
57%
7-Day Rank
#4
30-Day Rank
#24
365-Day Rank
#140
Slinky Dog Dash
Average Posted Wait
61
Actual Waits Were
81%
7-Day Rank
#4
30-Day Rank
#22
365-Day Rank
#152
Alien Swirling Saucers
Average Posted Wait
25
7-Day Rank
#6
30-Day Rank
#28
365-Day Rank
#156
Mickey & Minnie’s Runaway Railway
Average Posted Wait
36
Actual Waits Were
86%
7-Day Rank
#6
30-Day Rank
#22
365-Day Rank
#273
Millennium Falcon: Smugglers Run
Average Posted Wait
46
Actual Waits Were
88%
7-Day Rank
#5
30-Day Rank
#29
365-Day Rank
#204

EPCOT Wait Times

Spaceship Earth had an average wait time today of 27 minutes. Its 7-day average is 31 minutes, so today ranks #6 for this week. Its 30-day average is 32 minutes, so today ranks #25 for the past month. Its 365-day average is 19 minutes, so today ranks #72 for the past year. We received 7 actual wait times today, and the actual wait averaged 35% of the posted wait time.

EPCOT wait times for Saturday, April 24, 2021
Gran Fiesta Tour Starring The Three Caballeros
Average Posted Wait
9
7-Day Rank
#1
30-Day Rank
#5
365-Day Rank
#126
Journey Into Imagination With Figment
Average Posted Wait
14
7-Day Rank
#5
30-Day Rank
#26
365-Day Rank
#131
Living with the Land
Average Posted Wait
13
7-Day Rank
#3
30-Day Rank
#14
365-Day Rank
#78
Mission: SPACE Orange
Average Posted Wait
42
7-Day Rank
#2
30-Day Rank
#20
365-Day Rank
#57
Soarin’
Average Posted Wait
52
7-Day Rank
#2
30-Day Rank
#20
365-Day Rank
#68
Spaceship Earth
Average Posted Wait
27
Actual Waits Were
35%
7-Day Rank
#6
30-Day Rank
#25
365-Day Rank
#72
Test Track
Average Posted Wait
49
7-Day Rank
#6
30-Day Rank
#28
365-Day Rank
#174
The Seas with Nemo & Friends
Average Posted Wait
13
7-Day Rank
#6
30-Day Rank
#28
365-Day Rank
#86
Frozen Ever After
Average Posted Wait
41
7-Day Rank
#5
30-Day Rank
#24
365-Day Rank
#150

The post A Slow Saturday – Disney World Wait Times for April 24, 2021 appeared first on TouringPlans.com Blog.