

Sorry for the late post here – I was out of the office on Saturday. We received 278 actual wait times on Saturday from our fabulous Lines community. And we counted 482 of 500 (96%) guests wearing masks at Disney Springs according to Disney’s mask guidelines. Here’s the rest of the numbers!
Magic Kingdom Wait Times
Buzz Lightyear’s Space Ranger Spin had an average wait time today of 28 minutes. Its 7-day average is 38 minutes, so today ranks #5 for this week. Its 30-day average is 40 minutes, so today ranks #28 for the past month. Its 365-day average is 30 minutes, so today ranks #165 for the past year. We received 13 actual wait times today, and the actual wait averaged 41% of the posted wait time.

Astro Orbiter had an average wait time today of 37 minutes. Its 7-day average is 36 minutes, so today ranks #2 for this week. Its 30-day average is 38 minutes, so today ranks #17 for the past month. Its 365-day average is 32 minutes, so today ranks #97 for the past year.
Big Thunder Mountain Railroad had an average wait time today of 25 minutes. Its 7-day average is 34 minutes, so today ranks #5 for this week. Its 30-day average is 40 minutes, so today ranks #28 for the past month. Its 365-day average is 43 minutes, so today ranks #257 for the past year. We received 11 actual wait times today, and the actual wait averaged 30% of the posted wait time.
“it’s a small world” had an average wait time today of 30 minutes. Its 7-day average is 34 minutes, so today ranks #5 for this week. Its 30-day average is 42 minutes, so today ranks #27 for the past month. Its 365-day average is 36 minutes, so today ranks #196 for the past year. We received 4 actual wait times today, and the actual wait averaged 69% of the posted wait time.
Jungle Cruise had an average wait time today of 40 minutes. Its 7-day average is 45 minutes, so today ranks #5 for this week. Its 30-day average is 49 minutes, so today ranks #28 for the past month. Its 365-day average is 40 minutes, so today ranks #152 for the past year. We received 5 actual wait times today, and the actual wait averaged 76% of the posted wait time.
Mad Tea Party had an average wait time today of 13 minutes. Its 7-day average is 16 minutes, so today ranks #4 for this week. Its 30-day average is 19 minutes, so today ranks #27 for the past month. Its 365-day average is 13 minutes, so today ranks #120 for the past year.
Mickey’s PhilharMagic had an average wait time today of 33 minutes. Its 7-day average is 30 minutes, so today ranks #1 for this week. Its 30-day average is 31 minutes, so today ranks #3 for the past month. Its 365-day average is 22 minutes, so today ranks #11 for the past year.
Peter Pan’s Flight had an average wait time today of 34 minutes. Its 7-day average is 36 minutes, so today ranks #4 for this week. Its 30-day average is 41 minutes, so today ranks #27 for the past month. Its 365-day average is 33 minutes, so today ranks #139 for the past year. We received 6 actual wait times today, and the actual wait averaged 62% of the posted wait time.
Pirates of the Caribbean had an average wait time today of 34 minutes. Its 7-day average is 37 minutes, so today ranks #4 for this week. Its 30-day average is 50 minutes, so today ranks #27 for the past month. Its 365-day average is 43 minutes, so today ranks #210 for the past year. We received 13 actual wait times today, and the actual wait averaged 82% of the posted wait time.
Tom Sawyer Island had an average wait time today of 27 minutes. Its 7-day average is 5 minutes, so today ranks #1 for this week. Its 30-day average is 5 minutes, so today ranks #1 for the past month. Its 365-day average is 5 minutes, so today ranks #1 for the past year.
Space Mountain had an average wait time today of 36 minutes. Its 7-day average is 36 minutes, so today ranks #3 for this week. Its 30-day average is 49 minutes, so today ranks #26 for the past month. Its 365-day average is 37 minutes, so today ranks #148 for the past year. We received 9 actual wait times today, and the actual wait averaged 64% of the posted wait time.
Splash Mountain had an average wait time today of 56 minutes. Its 7-day average is 64 minutes, so today ranks #5 for this week. Its 30-day average is 71 minutes, so today ranks #25 for the past month. Its 365-day average is 53 minutes, so today ranks #114 for the past year. We received 10 actual wait times today, and the actual wait averaged 74% of the posted wait time.
The Barnstormer had an average wait time today of 13 minutes. Its 7-day average is 15 minutes, so today ranks #4 for this week. Its 30-day average is 20 minutes, so today ranks #25 for the past month. Its 365-day average is 18 minutes, so today ranks #181 for the past year.
The Haunted Mansion had an average wait time today of 25 minutes. Its 7-day average is 25 minutes, so today ranks #3 for this week. Its 30-day average is 26 minutes, so today ranks #18 for the past month. Its 365-day average is 28 minutes, so today ranks #161 for the past year. We received 9 actual wait times today, and the actual wait averaged 65% of the posted wait time.
The Magic Carpets of Aladdin had an average wait time today of 18 minutes. Its 7-day average is 20 minutes, so today ranks #5 for this week. Its 30-day average is 20 minutes, so today ranks #20 for the past month. Its 365-day average is 14 minutes, so today ranks #55 for the past year.
The Many Adventures of Winnie the Pooh had an average wait time today of 25 minutes. Its 7-day average is 28 minutes, so today ranks #5 for this week. Its 30-day average is 28 minutes, so today ranks #26 for the past month. Its 365-day average is 24 minutes, so today ranks #134 for the past year. We received 4 actual wait times today, and the actual wait averaged 77% of the posted wait time.
Tomorrowland Speedway had an average wait time today of 18 minutes. Its 7-day average is 18 minutes, so today ranks #2 for this week. Its 30-day average is 20 minutes, so today ranks #17 for the past month. Its 365-day average is 16 minutes, so today ranks #98 for the past year.
Walt Disney’s Carousel of Progress had an average wait time today of 9 minutes. Its 7-day average is 5 minutes, so today ranks #1 for this week. Its 30-day average is 5 minutes, so today ranks #1 for the past month. Its 365-day average is 5 minutes, so today ranks #1 for the past year.
Seven Dwarfs Mine Train had an average wait time today of 53 minutes. Its 7-day average is 50 minutes, so today ranks #1 for this week. Its 30-day average is 60 minutes, so today ranks #23 for the past month. Its 365-day average is 57 minutes, so today ranks #163 for the past year. We received 9 actual wait times today, and the actual wait averaged 68% of the posted wait time.
Under the Sea ~ Journey of the Little Mermaid had an average wait time today of 23 minutes. Its 7-day average is 22 minutes, so today ranks #4 for this week. Its 30-day average is 23 minutes, so today ranks #16 for the past month. Its 365-day average is 20 minutes, so today ranks #130 for the past year. We received 6 actual wait times today, and the actual wait averaged 40% of the posted wait time.
Animal Kingdom Wait Times
Expedition Everest – Legend of the Forbidden Mountain had an average wait time today of 26 minutes. Its 7-day average is 20 minutes, so today ranks #1 for this week. Its 30-day average is 24 minutes, so today ranks #11 for the past month. Its 365-day average is 25 minutes, so today ranks #113 for the past year. We received 19 actual wait times today, and the actual wait averaged 45% of the posted wait time.

Kali River Rapids had an average wait time today of 22 minutes. Its 7-day average is 40 minutes, so today ranks #4 for this week. Its 30-day average is 41 minutes, so today ranks #12 for the past month. Its 365-day average is 20 minutes, so today ranks #60 for the past year. We received 6 actual wait times today, and the actual wait averaged 71% of the posted wait time.
Kilimanjaro Safaris had an average wait time today of 37 minutes. Its 7-day average is 44 minutes, so today ranks #4 for this week. Its 30-day average is 37 minutes, so today ranks #14 for the past month. Its 365-day average is 23 minutes, so today ranks #34 for the past year. We received 17 actual wait times today, and the actual wait averaged 61% of the posted wait time.
It’s Tough to Be a Bug! had an average wait time today of 28 minutes. Its 7-day average is 29 minutes, so today ranks #4 for this week. Its 30-day average is 30 minutes, so today ranks #25 for the past month. Its 365-day average is 17 minutes, so today ranks #53 for the past year.
TriceraTop Spin had an average wait time today of 12 minutes. Its 7-day average is 9 minutes, so today ranks #1 for this week. Its 30-day average is 9 minutes, so today ranks #6 for the past month. Its 365-day average is 7 minutes, so today ranks #21 for the past year.
Na’vi River Journey had an average wait time today of 37 minutes. Its 7-day average is 40 minutes, so today ranks #4 for this week. Its 30-day average is 43 minutes, so today ranks #22 for the past month. Its 365-day average is 46 minutes, so today ranks #190 for the past year. We received 6 actual wait times today, and the actual wait averaged 61% of the posted wait time.
Avatar Flight of Passage had an average wait time today of 61 minutes. Its 7-day average is 60 minutes, so today ranks #1 for this week. Its 30-day average is 71 minutes, so today ranks #23 for the past month. Its 365-day average is 49 minutes, so today ranks #101 for the past year. We received 21 actual wait times today, and the actual wait averaged 81% of the posted wait time.
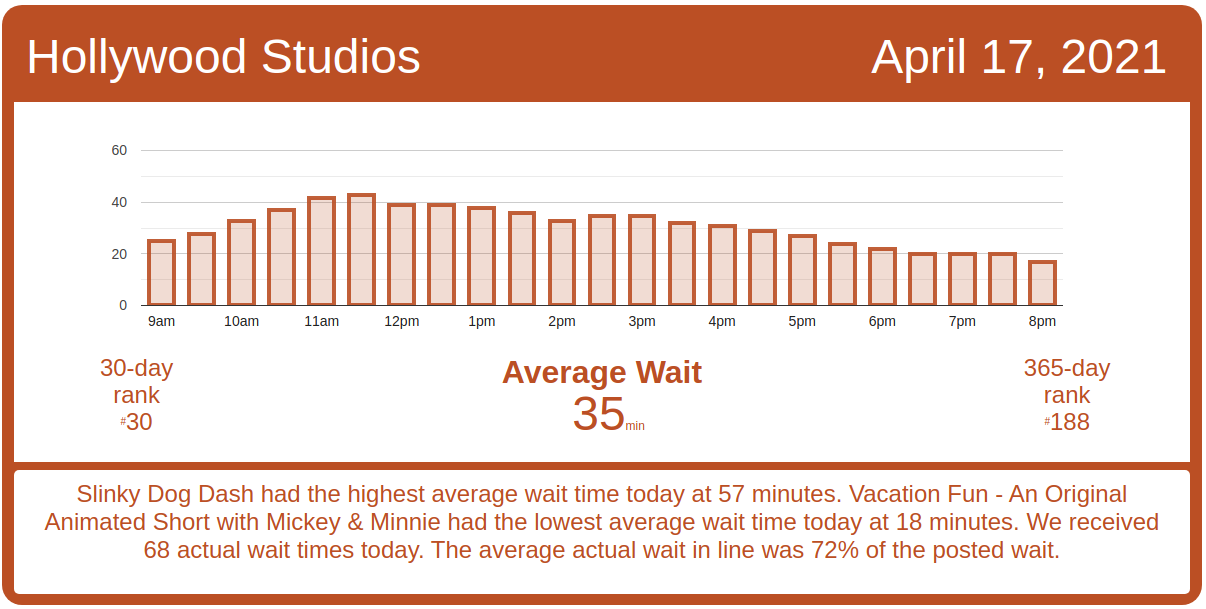
Hollywood Studios Wait Times
Rock ‘n’ Roller Coaster Starring Aerosmith had an average wait time today of 33 minutes. Its 7-day average is 34 minutes, so today ranks #4 for this week. Its 30-day average is 42 minutes, so today ranks #27 for the past month. Its 365-day average is 41 minutes, so today ranks #207 for the past year. We received 8 actual wait times today, and the actual wait averaged 78% of the posted wait time.
Rise of the Resistance had a decent day of operations yesterday, with a couple of outages: one of about half an hour at noon around boarding group 65, and about an hour around 4 PM at boarding group 188.

Star Tours: The Adventures Continue had an average wait time today of 30 minutes. Its 7-day average is 31 minutes, so today ranks #5 for this week. Its 30-day average is 34 minutes, so today ranks #28 for the past month. Its 365-day average is 28 minutes, so today ranks #130 for the past year. We received 6 actual wait times today, and the actual wait averaged 68% of the posted wait time.
The Twilight Zone Tower of Terror had an average wait time today of 49 minutes. Its 7-day average is 59 minutes, so today ranks #6 for this week. Its 30-day average is 65 minutes, so today ranks #29 for the past month. Its 365-day average is 52 minutes, so today ranks #152 for the past year. We received 6 actual wait times today, and the actual wait averaged 67% of the posted wait time.
Toy Story Mania! had an average wait time today of 31 minutes. Its 7-day average is 29 minutes, so today ranks #1 for this week. Its 30-day average is 32 minutes, so today ranks #18 for the past month. Its 365-day average is 27 minutes, so today ranks #83 for the past year. We received 13 actual wait times today, and the actual wait averaged 55% of the posted wait time.
Slinky Dog Dash had an average wait time today of 57 minutes. Its 7-day average is 61 minutes, so today ranks #5 for this week. Its 30-day average is 71 minutes, so today ranks #29 for the past month. Its 365-day average is 59 minutes, so today ranks #166 for the past year. We received 7 actual wait times today, and the actual wait averaged 69% of the posted wait time.
Alien Swirling Saucers had an average wait time today of 25 minutes. Its 7-day average is 29 minutes, so today ranks #5 for this week. Its 30-day average is 30 minutes, so today ranks #28 for the past month. Its 365-day average is 24 minutes, so today ranks #135 for the past year. We received 6 actual wait times today, and the actual wait averaged 44% of the posted wait time.
Mickey & Minnie’s Runaway Railway had an average wait time today of 43 minutes. Its 7-day average is 40 minutes, so today ranks #1 for this week. Its 30-day average is 39 minutes, so today ranks #5 for the past month. Its 365-day average is 55 minutes, so today ranks #207 for the past year. We received 13 actual wait times today, and the actual wait averaged 93% of the posted wait time.
Millennium Falcon: Smugglers Run had an average wait time today of 48 minutes. Its 7-day average is 52 minutes, so today ranks #4 for this week. Its 30-day average is 58 minutes, so today ranks #26 for the past month. Its 365-day average is 53 minutes, so today ranks #183 for the past year. We received 8 actual wait times today, and the actual wait averaged 97% of the posted wait time.
Lightning McQueen’s Racing Academy had an average wait time today of 29 minutes. Its 7-day average is 29 minutes, so today ranks #4 for this week. Its 30-day average is 30 minutes, so today ranks #24 for the past month. Its 365-day average is 21 minutes, so today ranks #77 for the past year.
EPCOT Wait Times
Journey Into Imagination With Figment had an average wait time today of 20 minutes. Its 7-day average is 18 minutes, so today ranks #4 for this week. Its 30-day average is 19 minutes, so today ranks #15 for the past month. Its 365-day average is 14 minutes, so today ranks #68 for the past year.

Living with the Land had an average wait time today of 12 minutes. Its 7-day average is 12 minutes, so today ranks #4 for this week. Its 30-day average is 12 minutes, so today ranks #17 for the past month. Its 365-day average is 11 minutes, so today ranks #108 for the past year.
Mission: SPACE Orange had an average wait time today of 46 minutes. Its 7-day average is 44 minutes, so today ranks #3 for this week. Its 30-day average is 49 minutes, so today ranks #18 for the past month. Its 365-day average is 29 minutes, so today ranks #41 for the past year.
Soarin’ had an average wait time today of 48 minutes. Its 7-day average is 52 minutes, so today ranks #5 for this week. Its 30-day average is 61 minutes, so today ranks #30 for the past month. Its 365-day average is 36 minutes, so today ranks #83 for the past year. We received 7 actual wait times today, and the actual wait averaged 64% of the posted wait time.
Spaceship Earth had an average wait time today of 29 minutes. Its 7-day average is 31 minutes, so today ranks #4 for this week. Its 30-day average is 31 minutes, so today ranks #21 for the past month. Its 365-day average is 19 minutes, so today ranks #56 for the past year.
Test Track had an average wait time today of 60 minutes. Its 7-day average is 53 minutes, so today ranks #1 for this week. Its 30-day average is 67 minutes, so today ranks #20 for the past month. Its 365-day average is 55 minutes, so today ranks #112 for the past year. We received 4 actual wait times today, and the actual wait averaged 73% of the posted wait time.
The Seas with Nemo & Friends had an average wait time today of 18 minutes. Its 7-day average is 18 minutes, so today ranks #4 for this week. Its 30-day average is 18 minutes, so today ranks #14 for the past month. Its 365-day average is 12 minutes, so today ranks #32 for the past year.
Frozen Ever After had an average wait time today of 38 minutes. Its 7-day average is 41 minutes, so today ranks #5 for this week. Its 30-day average is 49 minutes, so today ranks #27 for the past month. Its 365-day average is 46 minutes, so today ranks #158 for the past year.
The post Disney World wait times for Saturday, April 17, 2021 appeared first on TouringPlans.com Blog.