Moderate Crowds: Disney World Wait Times for Monday, April 19, 2021

Crowds were moderate across Walt Disney World today, with only the Magic Kingdom’s average posted times creeping into the top 10 days of the past month. And even then, actual wait times at the park were one-third lower than posted waits.

We counted 481 of 500 (96%) guests at Magic Kingdom wearing masks according to Disney’s current guidelines. And we’ve received 228 actual wait times so far today from our fabulous Lines community! Let’s do the rest of the numbers!

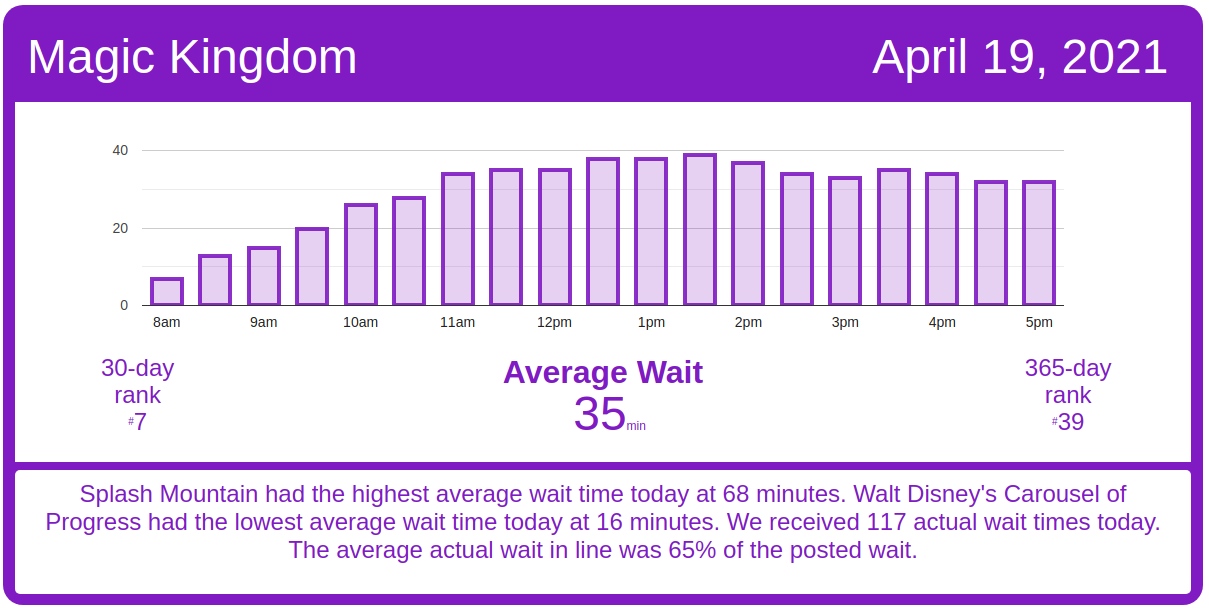
Magic Kingdom Wait Times

Seven Dwarfs Mine Train had an average wait time today of 56 minutes. Its 7-day average is 50 minutes, so today ranks #1 for this week. Its 30-day average is 59 minutes, so today ranks #19 for the past month. Its 365-day average is 57 minutes, so today ranks #148 for the past year. We received 5 actual wait times today, and the actual wait averaged 73% of the posted wait time.

Magic Kingdom wait times for Monday, April 19, 2021
Astro Orbiter
Average Posted Wait
45
7-Day Rank
#1
30-Day Rank
#1
365-Day Rank
#18
Big Thunder Mountain Railroad
Average Posted Wait
39
Actual Waits Were
21%
7-Day Rank
#1
30-Day Rank
#14
365-Day Rank
#172
Buzz Lightyear’s Space Ranger Spin
Average Posted Wait
26
Actual Waits Were
61%
7-Day Rank
#5
30-Day Rank
#28
365-Day Rank
#183
Prince Charming Regal Carrousel
Average Posted Wait
31
7-Day Rank
#1
30-Day Rank
#1
365-Day Rank
#1
Country Bear Jamboree
Average Posted Wait
28
7-Day Rank
#1
30-Day Rank
#1
365-Day Rank
#1
Dumbo the Flying Elephant
Average Posted Wait
27
7-Day Rank
#1
30-Day Rank
#2
365-Day Rank
#11
“it’s a small world”
Average Posted Wait
38
7-Day Rank
#1
30-Day Rank
#19
365-Day Rank
#128
Jungle Cruise
Average Posted Wait
50
Actual Waits Were
87%
7-Day Rank
#1
30-Day Rank
#11
365-Day Rank
#40
Mad Tea Party
Average Posted Wait
21
7-Day Rank
#1
30-Day Rank
#6
365-Day Rank
#27
Mickey’s PhilharMagic
Average Posted Wait
32
7-Day Rank
#1
30-Day Rank
#5
365-Day Rank
#17
Peter Pan’s Flight
Average Posted Wait
41
Actual Waits Were
83%
7-Day Rank
#1
30-Day Rank
#11
365-Day Rank
#69
Pirates of the Caribbean
Average Posted Wait
55
Actual Waits Were
66%
7-Day Rank
#1
30-Day Rank
#8
365-Day Rank
#60
Tom Sawyer Island
Average Posted Wait
36
7-Day Rank
#1
30-Day Rank
#1
365-Day Rank
#1
Space Mountain
Average Posted Wait
44
Actual Waits Were
78%
7-Day Rank
#1
30-Day Rank
#17
365-Day Rank
#110
Splash Mountain
Average Posted Wait
68
Actual Waits Were
101%
7-Day Rank
#3
30-Day Rank
#22
365-Day Rank
#75
The Barnstormer
Average Posted Wait
23
Actual Waits Were
73%
7-Day Rank
#1
30-Day Rank
#10
365-Day Rank
#99
The Haunted Mansion
Average Posted Wait
31
Actual Waits Were
62%
7-Day Rank
#1
30-Day Rank
#6
365-Day Rank
#91
The Magic Carpets of Aladdin
Average Posted Wait
24
7-Day Rank
#1
30-Day Rank
#1
365-Day Rank
#6
The Many Adventures of Winnie the Pooh
Average Posted Wait
30
7-Day Rank
#1
30-Day Rank
#8
365-Day Rank
#50
Tomorrowland Speedway
Average Posted Wait
34
7-Day Rank
#1
30-Day Rank
#1
365-Day Rank
#5
Seven Dwarfs Mine Train
Average Posted Wait
56
Actual Waits Were
73%
7-Day Rank
#1
30-Day Rank
#19
365-Day Rank
#148
Under the Sea ~ Journey of the Little Mermaid
Average Posted Wait
26
Actual Waits Were
52%
7-Day Rank
#1
30-Day Rank
#6
365-Day Rank
#88

Animal Kingdom Wait Times

Avatar Flight of Passage had an average wait time today of 56 minutes. Its 7-day average is 59 minutes, so today ranks #5 for this week. Its 30-day average is 70 minutes, so today ranks #28 for the past month. We received 5 actual wait times today, and the actual wait averaged 80% of the posted wait time.

Animal Kingdom wait times for Monday, April 19, 2021
DINOSAUR
Average Posted Wait
50
7-Day Rank
#1
30-Day Rank
#8
365-Day Rank
#52
Expedition Everest – Legend of the Forbidden Mountain
Average Posted Wait
25
Actual Waits Were
62%
7-Day Rank
#3
30-Day Rank
#17
365-Day Rank
#135
Kali River Rapids
Average Posted Wait
16
7-Day Rank
#6
30-Day Rank
#17
365-Day Rank
#91
Kilimanjaro Safaris
Average Posted Wait
64
7-Day Rank
#1
30-Day Rank
#1
365-Day Rank
#1
It’s Tough to Be a Bug!
Average Posted Wait
29
7-Day Rank
#4
30-Day Rank
#21
365-Day Rank
#46
TriceraTop Spin
Average Posted Wait
9
7-Day Rank
#2
30-Day Rank
#16
365-Day Rank
#47
Na’vi River Journey
Average Posted Wait
36
7-Day Rank
#6
30-Day Rank
#24
365-Day Rank
#206
Avatar Flight of Passage
Average Posted Wait
56
Actual Waits Were
80%
7-Day Rank
#5
30-Day Rank
#28
365-Day Rank
#123

Hollywood Studios Wait Times

Millennium Falcon: Smugglers Run had an average wait time today of 54 minutes. Its 7-day average is 50 minutes, so today ranks #1 for this week. Its 30-day average is 57 minutes, so today ranks #19 for the past month. We received 4 actual wait times today, and the actual wait averaged 74% of the posted wait time.

Hollywood Studios wait times for Monday, April 19, 2021

Rise of the Resistance is having an excellent day of operations, with no delays in calling boarding groups at any point in the day.  Rise of the Resistance began calling boarding groups at 8:30 a.m.  As I write this, they’re currently at boarding group 135 and well ahead of their best pace for the past week.  ROTR should be able to get to at least boarding group 165 today.  Great job by the Rise team.

Rise of the Resistance boarding groups for Monday, April 19, 2021
Muppet*Vision 3D
Average Posted Wait
33
7-Day Rank
#2
30-Day Rank
#14
365-Day Rank
#41
Rock ‘n’ Roller Coaster Starring Aerosmith
Average Posted Wait
43
Actual Waits Were
91%
7-Day Rank
#1
30-Day Rank
#13
365-Day Rank
#137
Star Tours: The Adventures Continue
Average Posted Wait
33
Actual Waits Were
66%
7-Day Rank
#1
30-Day Rank
#15
365-Day Rank
#94
The Twilight Zone Tower of Terror
Average Posted Wait
55
Actual Waits Were
90%
7-Day Rank
#2
30-Day Rank
#21
365-Day Rank
#108
Toy Story Mania!
Average Posted Wait
29
Actual Waits Were
77%
7-Day Rank
#4
30-Day Rank
#22
365-Day Rank
#124
Walt Disney Presents
Average Posted Wait
20
7-Day Rank
#1
30-Day Rank
#1
365-Day Rank
#1
Slinky Dog Dash
Average Posted Wait
76
Actual Waits Were
53%
7-Day Rank
#1
30-Day Rank
#8
365-Day Rank
#26
Alien Swirling Saucers
Average Posted Wait
31
7-Day Rank
#2
30-Day Rank
#9
365-Day Rank
#46
Mickey & Minnie’s Runaway Railway
Average Posted Wait
43
Actual Waits Were
87%
7-Day Rank
#1
30-Day Rank
#4
365-Day Rank
#198
Millennium Falcon: Smugglers Run
Average Posted Wait
54
Actual Waits Were
74%
7-Day Rank
#1
30-Day Rank
#19
365-Day Rank
#145
Star Wars: Rise of the Resistance
Average Posted Wait
45
7-Day Rank
#1
30-Day Rank
#1
365-Day Rank
#1

EPCOT Wait Times

Soarin’ had an average wait time today of 44 minutes. Its 7-day average is 52 minutes, so today ranks #6 for this week. Its 30-day average is 61 minutes, so today ranks #30 for the past month. We received 8 actual wait times today, and the actual wait averaged 59% of the posted wait time.

EPCOT wait times for Monday, April 19, 2021
Gran Fiesta Tour Starring The Three Caballeros
Average Posted Wait
5
7-Day Rank
#6
30-Day Rank
#27
365-Day Rank
#266
Journey Into Imagination With Figment
Average Posted Wait
15
Actual Waits Were
78%
7-Day Rank
#6
30-Day Rank
#27
365-Day Rank
#114
Living with the Land
Average Posted Wait
8
7-Day Rank
#6
30-Day Rank
#29
365-Day Rank
#217
Mission: SPACE Orange
Average Posted Wait
39
7-Day Rank
#5
30-Day Rank
#27
365-Day Rank
#75
Soarin’
Average Posted Wait
44
Actual Waits Were
59%
7-Day Rank
#6
30-Day Rank
#30
365-Day Rank
#98
Spaceship Earth
Average Posted Wait
30
7-Day Rank
#4
30-Day Rank
#21
365-Day Rank
#53
Test Track
Average Posted Wait
47
Actual Waits Were
74%
7-Day Rank
#6
30-Day Rank
#30
365-Day Rank
#175
The Seas with Nemo & Friends
Average Posted Wait
16
7-Day Rank
#5
30-Day Rank
#24
365-Day Rank
#57
Mission: SPACE Green
Average Posted Wait
15
7-Day Rank
#1
30-Day Rank
#7
365-Day Rank
#82
Frozen Ever After
Average Posted Wait
41
7-Day Rank
#5
30-Day Rank
#24
365-Day Rank
#146

The post Moderate Crowds: Disney World Wait Times for Monday, April 19, 2021 appeared first on TouringPlans.com Blog.