Moderate Park Crowds – Disney World Wait Times for Wednesday, April 21, 2021

Average posted wait times today at Walt Disney World were between the 11th- and 14th-highest they’ve been for the past month, putting all four parks’ crowds in the middle of the pack.  Those posted wait times seem a bit inflated at the Magic Kingdom and EPCOT, as the actual wait times we’ve got from those parks are only around 62% of the posted wait.  Thus, a posted wait of 60 minutes would’ve resulted in an actual wait of around 37 minutes.

We counted 481 of 500 guests (96%) at the Magic Kingdom today wearing masks according to Disney’s guidelines.  And we’ve got 172 actual wait times so far today from our fabulous Lines community! Let’s do the rest of the numbers!

Magic Kingdom Wait Times

Peter Pan’s Flight had an average wait time today of 40 minutes. Its 7-day average is 37 minutes, so today ranks #2 for this week. Its 30-day average is 39 minutes, so today ranks #12 for the past month. Its 365-day average is 33 minutes, so today ranks #81 for the past year. We received 5 actual wait times today, and the actual wait averaged 94% of the posted wait time.

Magic Kingdom wait times for Wednesday, April 21, 2021
Astro Orbiter
Average Posted Wait
39
7-Day Rank
#1
30-Day Rank
#12
365-Day Rank
#83
Big Thunder Mountain Railroad
Average Posted Wait
36
Actual Waits Were
25%
7-Day Rank
#1
30-Day Rank
#19
365-Day Rank
#203
Buzz Lightyear’s Space Ranger Spin
Average Posted Wait
36
7-Day Rank
#1
30-Day Rank
#21
365-Day Rank
#116
Prince Charming Regal Carrousel
Average Posted Wait
30
7-Day Rank
#1
30-Day Rank
#1
365-Day Rank
#1
Country Bear Jamboree
Average Posted Wait
25
7-Day Rank
#1
30-Day Rank
#1
365-Day Rank
#1
Dumbo the Flying Elephant
Average Posted Wait
28
7-Day Rank
#1
30-Day Rank
#1
365-Day Rank
#9
“it’s a small world”
Average Posted Wait
38
7-Day Rank
#1
30-Day Rank
#17
365-Day Rank
#125
Jungle Cruise
Average Posted Wait
45
Actual Waits Were
85%
7-Day Rank
#2
30-Day Rank
#18
365-Day Rank
#89
Mad Tea Party
Average Posted Wait
18
7-Day Rank
#2
30-Day Rank
#13
365-Day Rank
#60
Mickey’s PhilharMagic
Average Posted Wait
35
7-Day Rank
#1
30-Day Rank
#1
365-Day Rank
#1
Peter Pan’s Flight
Average Posted Wait
40
Actual Waits Were
94%
7-Day Rank
#2
30-Day Rank
#12
365-Day Rank
#81
Pirates of the Caribbean
Average Posted Wait
44
Actual Waits Were
101%
7-Day Rank
#1
30-Day Rank
#18
365-Day Rank
#149
Space Mountain
Average Posted Wait
43
Actual Waits Were
47%
7-Day Rank
#2
30-Day Rank
#17
365-Day Rank
#114
Splash Mountain
Average Posted Wait
75
Actual Waits Were
98%
7-Day Rank
#1
30-Day Rank
#12
365-Day Rank
#44
The Barnstormer
Average Posted Wait
15
7-Day Rank
#1
30-Day Rank
#20
365-Day Rank
#171
The Haunted Mansion
Average Posted Wait
33
Actual Waits Were
28%
7-Day Rank
#1
30-Day Rank
#1
365-Day Rank
#69
The Magic Carpets of Aladdin
Average Posted Wait
22
7-Day Rank
#1
30-Day Rank
#7
365-Day Rank
#18
The Many Adventures of Winnie the Pooh
Average Posted Wait
33
7-Day Rank
#1
30-Day Rank
#4
365-Day Rank
#26
Tomorrowland Speedway
Average Posted Wait
24
7-Day Rank
#2
30-Day Rank
#8
365-Day Rank
#44
Seven Dwarfs Mine Train
Average Posted Wait
50
7-Day Rank
#5
30-Day Rank
#26
365-Day Rank
#184
Under the Sea ~ Journey of the Little Mermaid
Average Posted Wait
25
Actual Waits Were
35%
7-Day Rank
#2
30-Day Rank
#9
365-Day Rank
#105

Animal Kingdom Wait Times

Kilimanjaro Safaris had an average wait time today of 58 minutes. Its 7-day average is 44 minutes, so today ranks #1 for this week. Its 30-day average is 39 minutes, so today ranks #2 for the past month. Its 365-day average is 23 minutes, so today ranks #2 for the past year. We received 14 actual wait times today, and the actual wait averaged 80% of the posted wait time.

Animal Kingdom wait times for Wednesday, April 21, 2021
DINOSAUR
Average Posted Wait
46
Actual Waits Were
97%
7-Day Rank
#1
30-Day Rank
#16
365-Day Rank
#79
Expedition Everest – Legend of the Forbidden Mountain
Average Posted Wait
24
Actual Waits Were
52%
7-Day Rank
#4
30-Day Rank
#18
365-Day Rank
#139
Kali River Rapids
Average Posted Wait
33
7-Day Rank
#2
30-Day Rank
#12
365-Day Rank
#35
Kilimanjaro Safaris
Average Posted Wait
58
Actual Waits Were
80%
7-Day Rank
#1
30-Day Rank
#2
365-Day Rank
#2
It’s Tough to Be a Bug!
Average Posted Wait
35
7-Day Rank
#1
30-Day Rank
#1
365-Day Rank
#1
TriceraTop Spin
Average Posted Wait
5
7-Day Rank
#4
30-Day Rank
#22
365-Day Rank
#96
Na’vi River Journey
Average Posted Wait
41
7-Day Rank
#1
30-Day Rank
#13
365-Day Rank
#159
Avatar Flight of Passage
Average Posted Wait
59
Actual Waits Were
72%
7-Day Rank
#2
30-Day Rank
#24
365-Day Rank
#113

Hollywood Studios Wait Times

Millennium Falcon: Smugglers Run had an average wait time today of 51 minutes. Its 7-day average is 49 minutes, so today ranks #1 for this week. Its 30-day average is 57 minutes, so today ranks #22 for the past month. Its 365-day average is 53 minutes, so today ranks #166 for the past year. We received 5 actual wait times today, and the actual wait averaged 79% of the posted wait time.

Hollywood Studios wait times for Wednesday, April 21, 2021

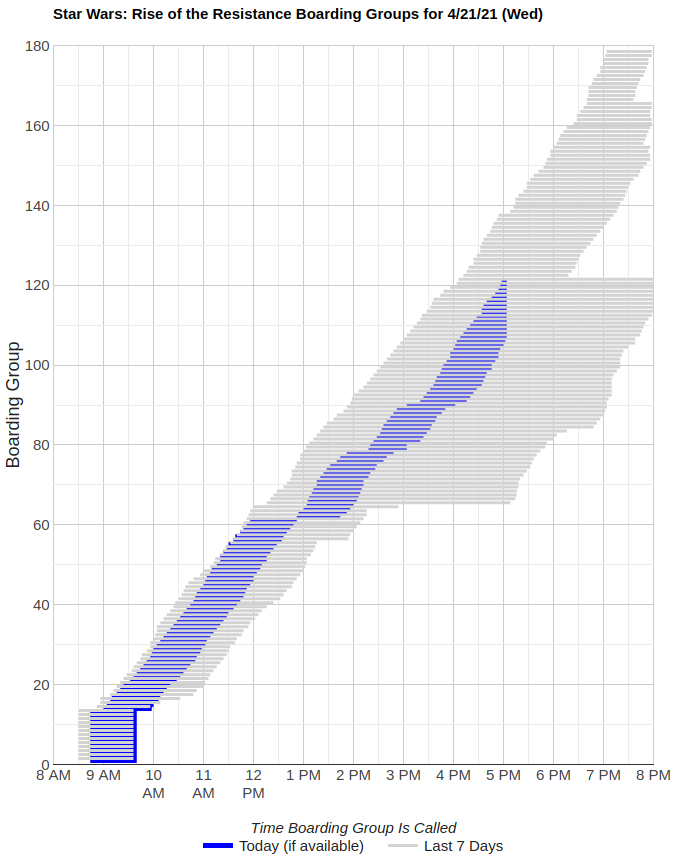
Rise of the Resistance isn’t having a great Wednesday.  Rise of the Resistance began calling boarding groups today at 8:45 a.m., and ran smoothly through the morning.  At one point around 11:30 a.m., Rise of the Resistance was at its fastest pace of the past week.  That lasted until boarding group 61 at noon.  Then, Rise experienced a delay of almost an hour in calling boarding group 62.

Once Rise of the Resistance was running again, it ran well until boarding group 77 at 1:50 p.m., when there was another delay of about 25 minutes in calling more boarding groups.  And it looks like ROTR had another delay of about 25 minutes just after 3:00 p.m.  At its current pace, Rise of the Resistance should be able to get to boarding group 160 today.

Rise of the Resistance boarding groups for Wednesday, April 21, 2021
Muppet*Vision 3D
Average Posted Wait
36
7-Day Rank
#1
30-Day Rank
#2
365-Day Rank
#6
Rock ‘n’ Roller Coaster Starring Aerosmith
Average Posted Wait
36
Actual Waits Were
95%
7-Day Rank
#3
30-Day Rank
#22
365-Day Rank
#185
Star Tours: The Adventures Continue
Average Posted Wait
34
7-Day Rank
#1
30-Day Rank
#11
365-Day Rank
#76
The Twilight Zone Tower of Terror
Average Posted Wait
54
7-Day Rank
#3
30-Day Rank
#22
365-Day Rank
#116
Toy Story Mania!
Average Posted Wait
32
Actual Waits Were
90%
7-Day Rank
#1
30-Day Rank
#10
365-Day Rank
#73
Walt Disney Presents
Average Posted Wait
25
7-Day Rank
#1
30-Day Rank
#1
365-Day Rank
#1
Alien Swirling Saucers
Average Posted Wait
33
7-Day Rank
#1
30-Day Rank
#2
365-Day Rank
#27
Mickey & Minnie’s Runaway Railway
Average Posted Wait
42
Actual Waits Were
98%
7-Day Rank
#2
30-Day Rank
#9
365-Day Rank
#227
Millennium Falcon: Smugglers Run
Average Posted Wait
51
Actual Waits Were
79%
7-Day Rank
#1
30-Day Rank
#22
365-Day Rank
#166

EPCOT Wait Times

Spaceship Earth had an average wait time today of 32 minutes. Its 7-day average is 31 minutes, so today ranks #2 for this week. Its 30-day average is 31 minutes, so today ranks #13 for the past month. Its 365-day average is 19 minutes, so today ranks #30 for the past year. We received 11 actual wait times today, and the actual wait averaged 62% of the posted wait time.

EPCOT wait times for Wednesday, April 21, 2021
Gran Fiesta Tour Starring The Three Caballeros
Average Posted Wait
5
7-Day Rank
#6
30-Day Rank
#27
365-Day Rank
#268
Journey Into Imagination With Figment
Average Posted Wait
22
7-Day Rank
#1
30-Day Rank
#2
365-Day Rank
#38
Living with the Land
Average Posted Wait
17
7-Day Rank
#1
30-Day Rank
#1
365-Day Rank
#22
Mission: SPACE Orange
Average Posted Wait
40
7-Day Rank
#4
30-Day Rank
#23
365-Day Rank
#67
Soarin’
Average Posted Wait
55
7-Day Rank
#1
30-Day Rank
#16
365-Day Rank
#48
Spaceship Earth
Average Posted Wait
32
Actual Waits Were
62%
7-Day Rank
#2
30-Day Rank
#13
365-Day Rank
#30
Test Track
Average Posted Wait
52
Actual Waits Were
46%
7-Day Rank
#4
30-Day Rank
#26
365-Day Rank
#154
The Seas with Nemo & Friends
Average Posted Wait
19
7-Day Rank
#1
30-Day Rank
#8
365-Day Rank
#21
Mission: SPACE Green
Average Posted Wait
15
7-Day Rank
#1
30-Day Rank
#6
365-Day Rank
#82
Frozen Ever After
Average Posted Wait
48
Actual Waits Were
86%
7-Day Rank
#1
30-Day Rank
#15
365-Day Rank
#113

The post Moderate Park Crowds – Disney World Wait Times for Wednesday, April 21, 2021 appeared first on TouringPlans.com Blog.