Rain Keeps Crowds Away – Disney World Wait Times for Sunday, April 11, 2021

Constant, heavy rain for most of this afternoon kept crowds out of Walt Disney World, with all four parks registering their lowest average wait times of the past month today.  We did manage to get 121 actual wait times so far today from our fabulous, poncho-wearing Lines community.  Let’s do the rest of the numbers!

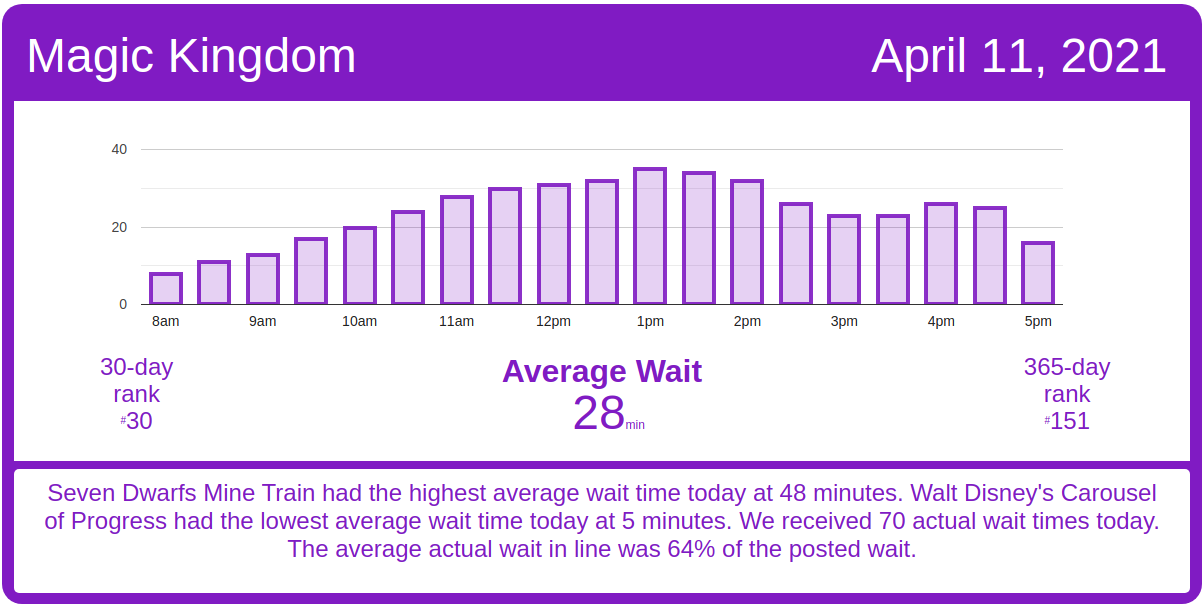
Magic Kingdom Wait Times

Splash Mountain had an average wait time today of 35 minutes. Its 7-day average is 77 minutes, so today ranks #6 for this week. Its 30-day average is 74 minutes, so today ranks #28 for the past month. Its 365-day average is 52 minutes, so today ranks #210 for the past year. We received 7 actual wait times today, and the actual wait averaged 76% of the posted wait time.

Magic Kingdom wait times for Sunday, April 11, 2021
Astro Orbiter
Average Posted Wait
40
7-Day Rank
#1
30-Day Rank
#12
365-Day Rank
#59
Big Thunder Mountain Railroad
Average Posted Wait
25
Actual Waits Were
38%
7-Day Rank
#6
30-Day Rank
#29
365-Day Rank
#252
Buzz Lightyear’s Space Ranger Spin
Average Posted Wait
46
7-Day Rank
#1
30-Day Rank
#1
365-Day Rank
#17
Prince Charming Regal Carrousel
Average Posted Wait
30
7-Day Rank
#1
30-Day Rank
#1
365-Day Rank
#1
Dumbo the Flying Elephant
Average Posted Wait
24
7-Day Rank
#1
30-Day Rank
#7
365-Day Rank
#26
“it’s a small world”
Average Posted Wait
35
7-Day Rank
#4
30-Day Rank
#27
365-Day Rank
#153
Jungle Cruise
Average Posted Wait
44
Actual Waits Were
94%
7-Day Rank
#5
30-Day Rank
#23
365-Day Rank
#108
Mad Tea Party
Average Posted Wait
13
7-Day Rank
#6
30-Day Rank
#29
365-Day Rank
#119
Mickey’s PhilharMagic
Average Posted Wait
43
7-Day Rank
#1
30-Day Rank
#1
365-Day Rank
#1
Peter Pan’s Flight
Average Posted Wait
35
Actual Waits Were
91%
7-Day Rank
#5
30-Day Rank
#28
365-Day Rank
#129
Pirates of the Caribbean
Average Posted Wait
35
Actual Waits Were
67%
7-Day Rank
#6
30-Day Rank
#29
365-Day Rank
#205
Space Mountain
Average Posted Wait
32
Actual Waits Were
74%
7-Day Rank
#6
30-Day Rank
#29
365-Day Rank
#159
Splash Mountain
Average Posted Wait
35
Actual Waits Were
76%
7-Day Rank
#6
30-Day Rank
#28
365-Day Rank
#210
The Barnstormer
Average Posted Wait
10
7-Day Rank
#6
30-Day Rank
#29
365-Day Rank
#195
The Haunted Mansion
Average Posted Wait
21
Actual Waits Were
33%
7-Day Rank
#4
30-Day Rank
#27
365-Day Rank
#195
The Magic Carpets of Aladdin
Average Posted Wait
18
7-Day Rank
#5
30-Day Rank
#22
365-Day Rank
#65
The Many Adventures of Winnie the Pooh
Average Posted Wait
28
Actual Waits Were
69%
7-Day Rank
#3
30-Day Rank
#18
365-Day Rank
#91
Tomorrowland Speedway
Average Posted Wait
14
7-Day Rank
#4
30-Day Rank
#26
365-Day Rank
#151
Seven Dwarfs Mine Train
Average Posted Wait
48
7-Day Rank
#6
30-Day Rank
#30
365-Day Rank
#193
Under the Sea ~ Journey of the Little Mermaid
Average Posted Wait
17
7-Day Rank
#6
30-Day Rank
#30
365-Day Rank
#178

Animal Kingdom Wait Times

Kilimanjaro Safaris had an average wait time today of 20 minutes. Its 7-day average is 37 minutes, so today ranks #6 for this week. Its 30-day average is 37 minutes, so today ranks #29 for the past month. Its 365-day average is 22 minutes, so today ranks #128 for the past year.

Animal Kingdom wait times for Sunday, April 11, 2021
DINOSAUR
Average Posted Wait
27
7-Day Rank
#6
30-Day Rank
#29
365-Day Rank
#155
Expedition Everest – Legend of the Forbidden Mountain
Average Posted Wait
20
7-Day Rank
#5
30-Day Rank
#28
365-Day Rank
#169
Kali River Rapids
Average Posted Wait
20
7-Day Rank
#6
30-Day Rank
#8
365-Day Rank
#64
Kilimanjaro Safaris
Average Posted Wait
20
7-Day Rank
#6
30-Day Rank
#29
365-Day Rank
#128
It’s Tough to Be a Bug!
Average Posted Wait
20
7-Day Rank
#7
30-Day Rank
#31
365-Day Rank
#94
TriceraTop Spin
Average Posted Wait
5
7-Day Rank
#4
30-Day Rank
#28
365-Day Rank
#90
Na’vi River Journey
Average Posted Wait
25
7-Day Rank
#6
30-Day Rank
#29
365-Day Rank
#230
Avatar Flight of Passage
Average Posted Wait
54
7-Day Rank
#6
30-Day Rank
#29
365-Day Rank
#121

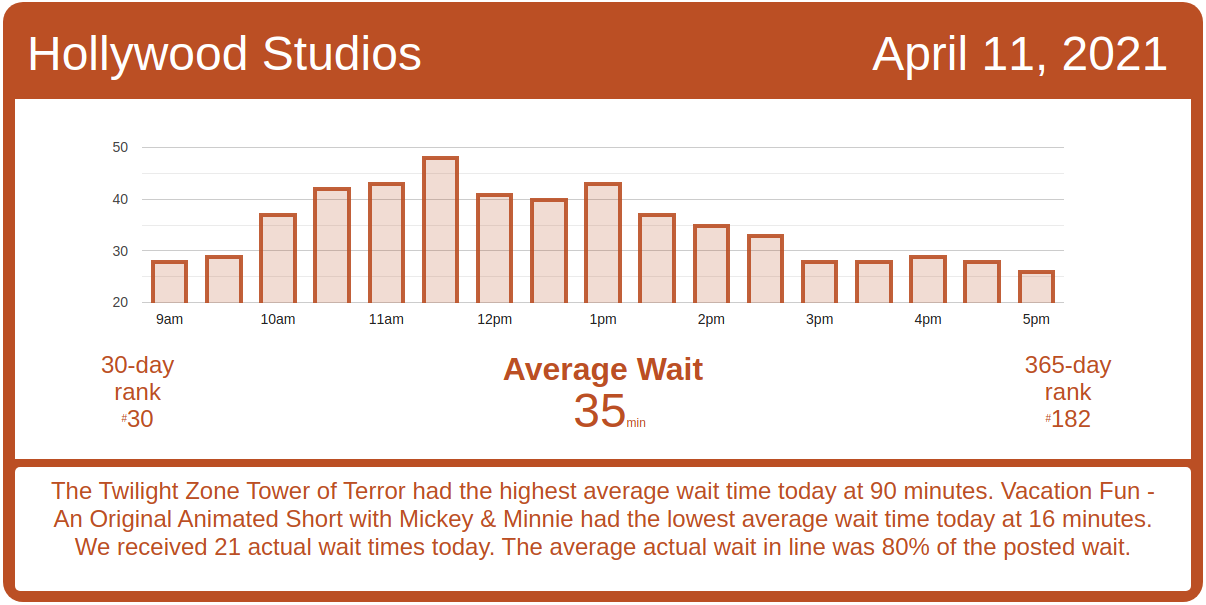
Hollywood Studios Wait Times

Rock ‘n’ Roller Coaster Starring Aerosmith had an average wait time today of 25 minutes. Its 7-day average is 43 minutes, so today ranks #6 for this week. Its 30-day average is 44 minutes, so today ranks #29 for the past month. Its 365-day average is 41 minutes, so today ranks #241 for the past year. We received 4 actual wait times today, and the actual wait averaged 94% of the posted wait time.

Hollywood Studios wait times for Sunday, April 11, 2021

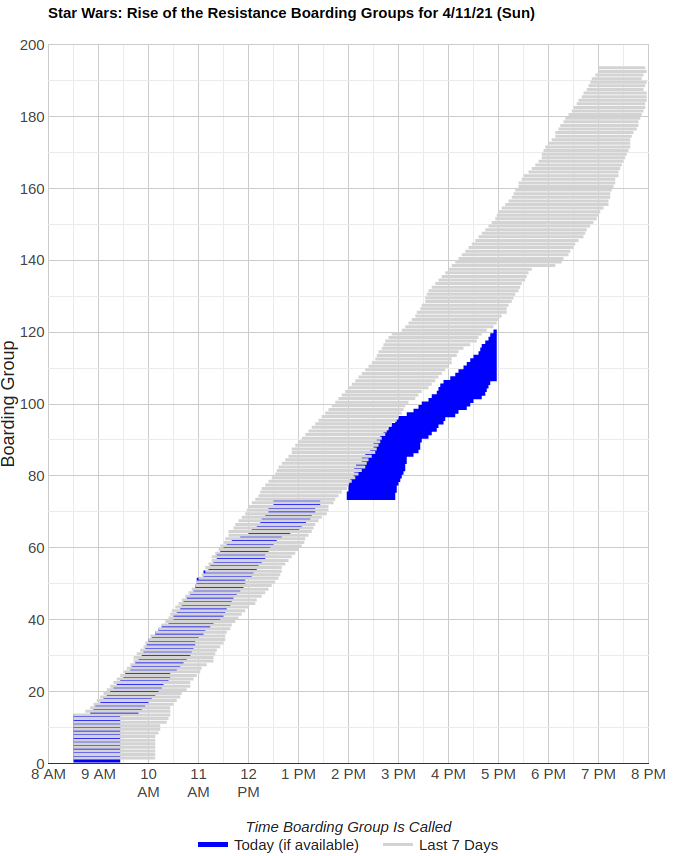
Rise of the Resistance is having another mixed day of operations. Rise of the Resistance began calling boarding groups at 8:30 AM this morning, and called boarding groups continuously until boarding group 74 at 12:30 PM.  At that point, there was a delay of 90 minutes in calling the next boarding group.  Boarding groups resumed around 2:00 PM and seemed to run well until around boarding group 96 at 3:00 PM, when the pace of calling new boarding groups seems to have slowed considerably.  At its current pace, it’s not clear that Rise of the Resistance will call 160 boarding groups today.  That would make today the worst performance of the past week.

Rise of the Resistance boarding groups for Sunday, April 11, 2021
Muppet*Vision 3D
Average Posted Wait
27
7-Day Rank
#6
30-Day Rank
#31
365-Day Rank
#96
Rock ‘n’ Roller Coaster Starring Aerosmith
Average Posted Wait
25
Actual Waits Were
94%
7-Day Rank
#6
30-Day Rank
#29
365-Day Rank
#241
Star Tours: The Adventures Continue
Average Posted Wait
31
7-Day Rank
#3
30-Day Rank
#23
365-Day Rank
#106
The Twilight Zone Tower of Terror
Average Posted Wait
90
7-Day Rank
#1
30-Day Rank
#1
365-Day Rank
#2
Toy Story Mania!
Average Posted Wait
22
7-Day Rank
#6
30-Day Rank
#29
365-Day Rank
#198
Slinky Dog Dash
Average Posted Wait
70
7-Day Rank
#2
30-Day Rank
#15
365-Day Rank
#69
Alien Swirling Saucers
Average Posted Wait
20
7-Day Rank
#6
30-Day Rank
#29
365-Day Rank
#202
Mickey & Minnie’s Runaway Railway
Average Posted Wait
30
Actual Waits Were
63%
7-Day Rank
#6
30-Day Rank
#30
365-Day Rank
#274
Millennium Falcon: Smugglers Run
Average Posted Wait
53
7-Day Rank
#4
30-Day Rank
#25
365-Day Rank
#149

EPCOT Wait Times

The Seas with Nemo & Friends had an average wait time today of 19 minutes. Its 7-day average is 20 minutes, so today ranks #3 for this week. Its 30-day average is 18 minutes, so today ranks #10 for the past month. Its 365-day average is 11 minutes, so today ranks #24 for the past year.

EPCOT wait times for Sunday, April 11, 2021
Gran Fiesta Tour Starring The Three Caballeros
Average Posted Wait
10
7-Day Rank
#1
30-Day Rank
#8
365-Day Rank
#113
Journey Into Imagination With Figment
Average Posted Wait
12
7-Day Rank
#6
30-Day Rank
#29
365-Day Rank
#138
Living with the Land
Average Posted Wait
11
7-Day Rank
#5
30-Day Rank
#21
365-Day Rank
#135
Mission: SPACE Orange
Average Posted Wait
28
7-Day Rank
#6
30-Day Rank
#29
365-Day Rank
#123
Soarin’
Average Posted Wait
39
7-Day Rank
#7
30-Day Rank
#31
365-Day Rank
#108
Spaceship Earth
Average Posted Wait
24
7-Day Rank
#6
30-Day Rank
#29
365-Day Rank
#81
Test Track
Average Posted Wait
45
7-Day Rank
#7
30-Day Rank
#31
365-Day Rank
#177
The Seas with Nemo & Friends
Average Posted Wait
19
7-Day Rank
#3
30-Day Rank
#10
365-Day Rank
#24
Frozen Ever After
Average Posted Wait
21
7-Day Rank
#6
30-Day Rank
#29
365-Day Rank
#245

The post Rain Keeps Crowds Away – Disney World Wait Times for Sunday, April 11, 2021 appeared first on TouringPlans.com Blog.