We’re back to take a look at this past week’s average times in Disney World!
Disney World has still been feeling the spring break crowds, especially as we’ve gotten closer to Easter. Park Pass reservations are still totally booked, but how did the wait times stack up? Let’s take a look!
Magic Kingdom
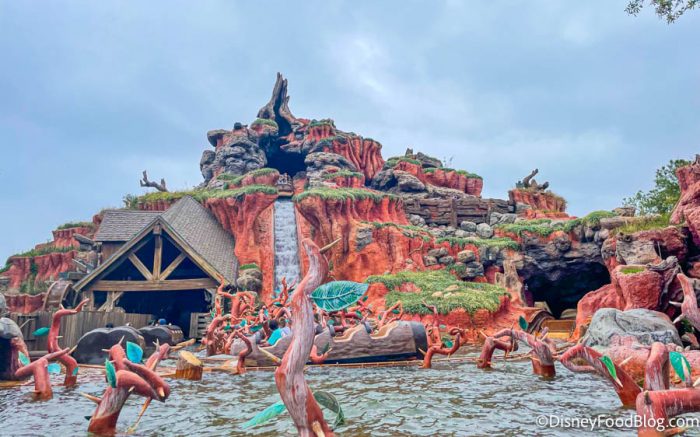
Last week, Splash Mountain tied with Seven Dwarfs Mine Train for the longest average wait time in Magic Kingdom. This week, it’s in the number one spot with an average wait of 68 minutes! That’s ten minutes longer than last week.
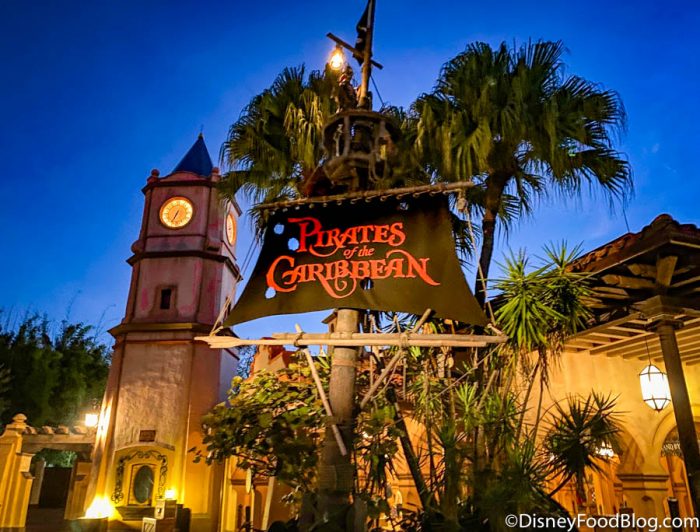
Following behind Splash Mountain was Seven Dwarfs Mine Train with an average wait of 56 minutes, Space Mountain with 47 minutes, and Pirates of the Caribbean with 46 minutes. Also, Jungle Cruise had an average wait time of 42 minutes.
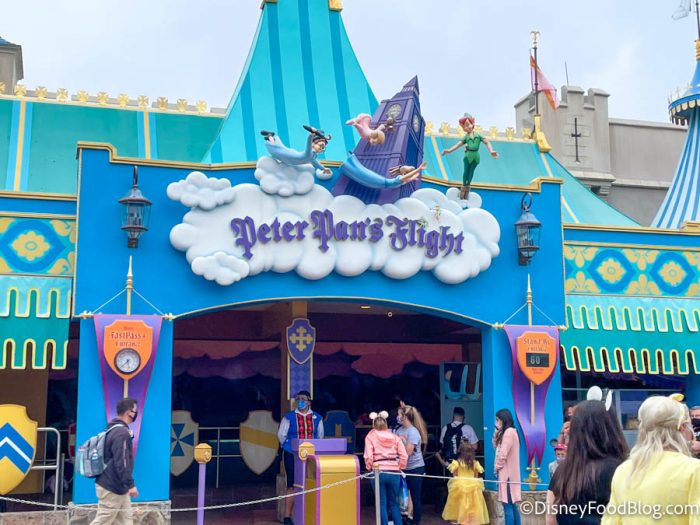
As we take a look at rides with average wait times in the 30s, we see Big Thunder Mountain Railroad at 36 minutes, “it’s a small world” at 38 minutes, Peter Pan’s Flight at 34 minutes, and Astro Orbiter and Buzz Lightyear’s Space Ranger Spin at 31 minutes.
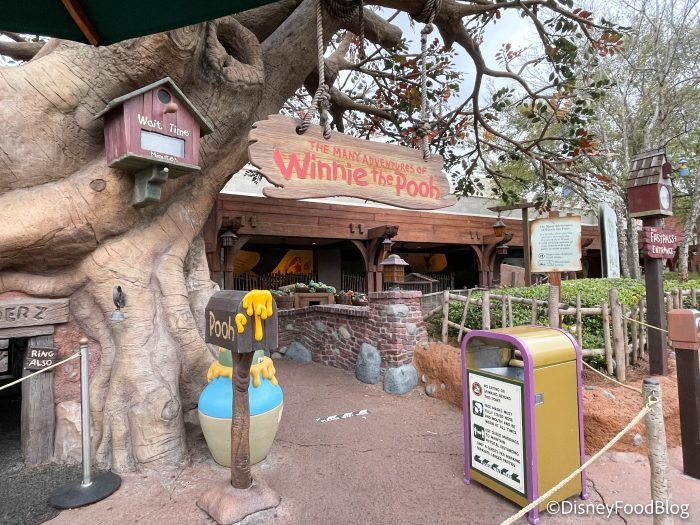
Rides with average wait times in the 20s include Prince Charming Regal Carrousel with an average wait time of 22 minutes, Mickey’s PhilharMagic with a wait time of 26 minutes, and Many Adventures of Winnie the Pooh with a wait time of 21 minutes.
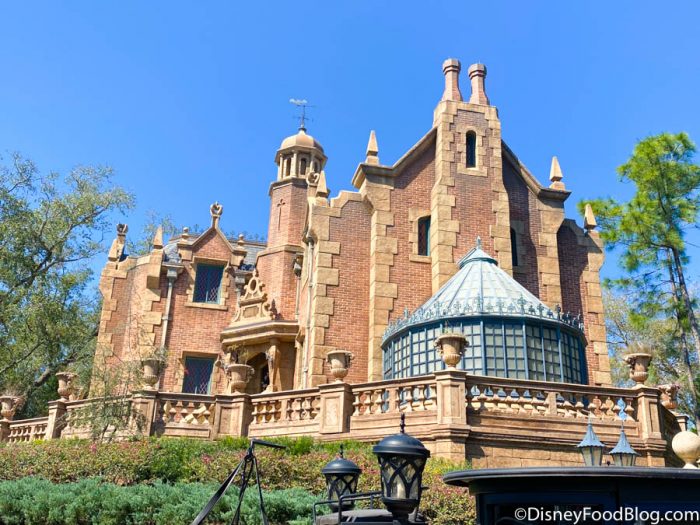
What were the rides with the lowest wait times in Magic Kingdom? Well, Haunted Mansion averaged a wait of 18 minutes, Under the Sea — Journey of the Little Mermaid averaged at 17 minutes, Tomorrowland Speedway at 18 minutes, Magic Carpets of Aladdin at 16 minutes, and Dumbo the Flying Elephant at 15 minutes.
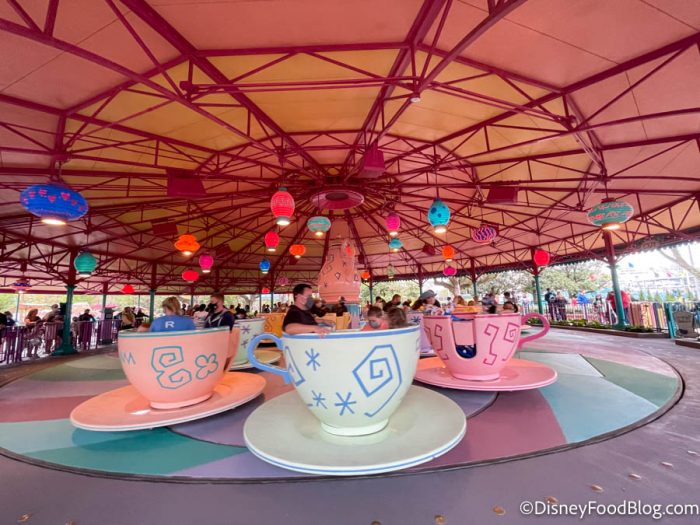
Coming in with the lowest average wait times in the park, we have Barnstormer featuring the Great Goofini at 14 minutes, Mad Tea Party at 13 minutes, Carousel of Progress at 8 minutes, and Liberty Square Riverboat at 5 minutes.
Some of these wait times were slightly shorter than last week, but generally speaking, they’re pretty similar! Let’s see how these numbers compare to the rest of Disney World!
This Magic Kingdom Ride Will NOT Close During Its Transformation
EPCOT
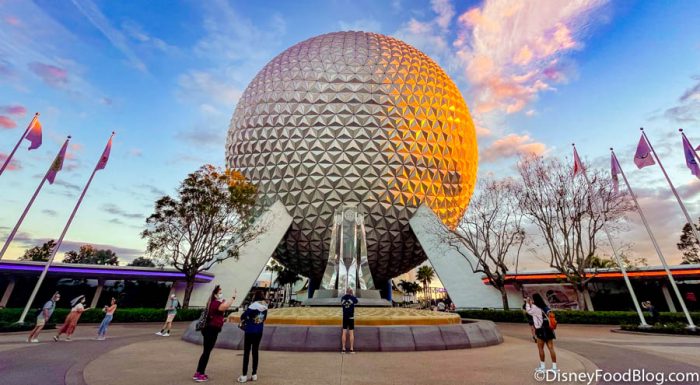
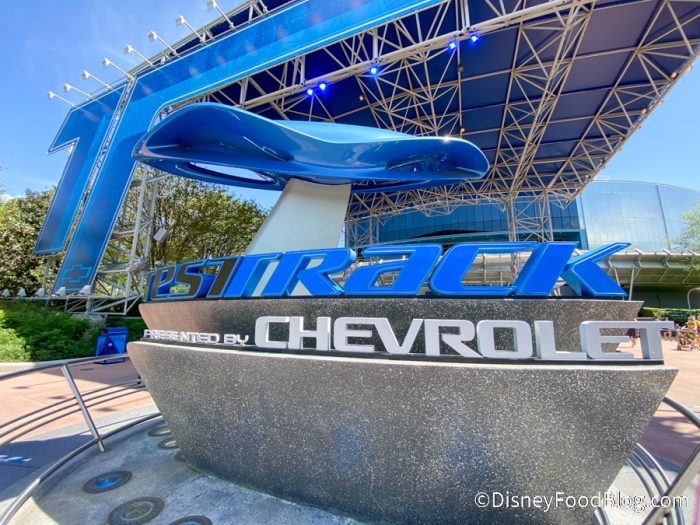
No surprise here, Test Track had the longest wait time in EPCOT once again with an average of 58 minutes. Following closely behind are Soarin’ at 54 minutes, and both Frozen Ever After and Mission: SPACE at 45 minutes.
Following those rides, we’ve got much shorter wait times! Spaceship Earth averaged a 25-minute wait, Journey Into Imagination averaged 16 minutes, and The Seas With Nemo and Friends averaged 14 minutes.
With especially low wait times, we have Living With the Land with a 10-minute average wait, and Gran Fiesta Tour with a 9-minute average wait.
This week’s wait times fall into the same range as last week’s! But, Magic Kingdom is still winning for having the longest average wait time so far.
The Plush Version of an EPCOT Snack Might Be Better Than the Real Thing
Disney’s Hollywood Studios
The longest wait time in Hollywood Studios was NOT Tower of Terror this week — it was Slinky Dog Dash! The Toy Story Land coaster had an average wait time of 71 minutes.
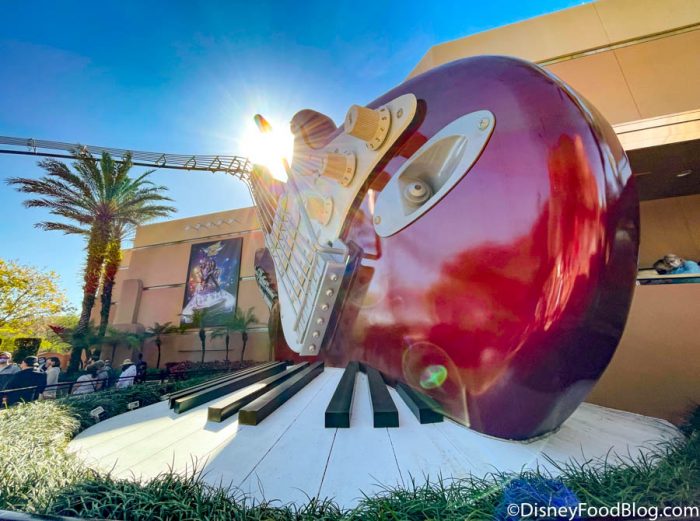
Next up, we’ve got Tower of Terror with a 63-minute average wait, Millennium Falcon: Smugglers Run with a 54-minute wait, and Rock ‘n’ Roller Coaster with a 41-minute wait! People really love their thrill rides!
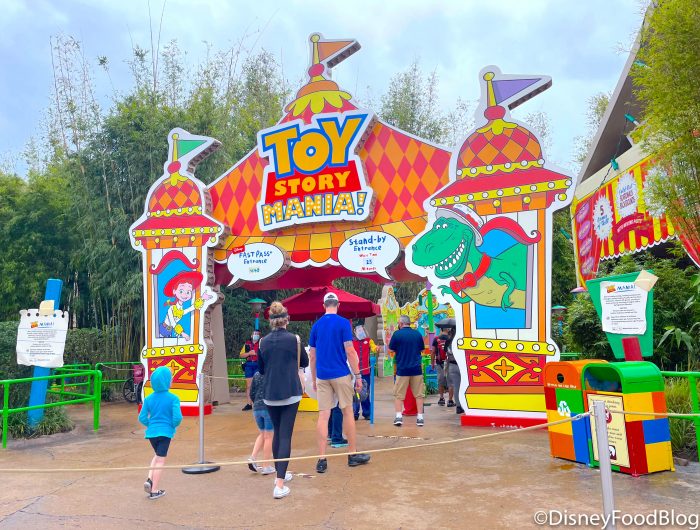
In the 30s, we have Mickey & Minnie’s Runaway Railway (35 minutes), and Toy Story Mania and Star Tours with 31-minute average wait times. Following closely behind are Alien Swirling Saucers (25 minutes), Muppet*Vision 3D (28 minutes), and Lightning McQueen’s Racing Academy (27 minutes).
This week’s average wait times in Hollywood Studios were slightly shorter than last week’s, except for those especially popular rides. Let’s check out Disney’s Animal Kingdom!
Disney’s Animal Kingdom
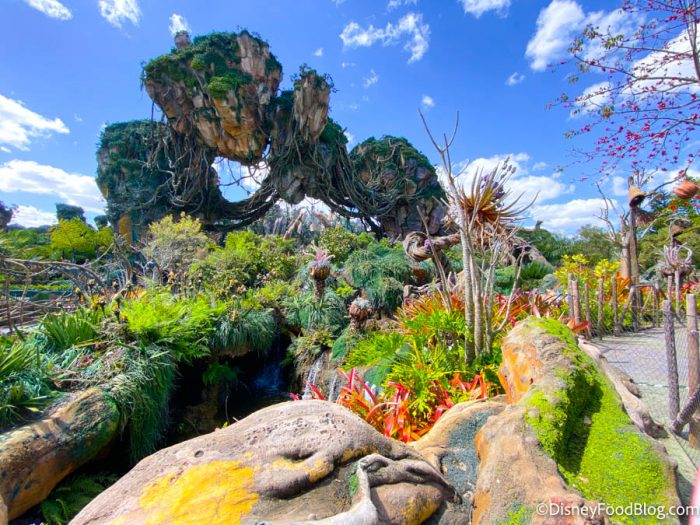
The longest average wait time in Animal Kingdom — and tying for longest wait time in Disney World this week — is Flight of Passage! The ride had an average wait time of 71 minutes, like Slinky Dog Dash. And this week, the wait time for Na’vi River Journey dropped even further, to 35 minutes, following the installation of plexiglass in the ride’s boats.
Dinosaur actually had a longer average wait time than Na’vi River Journey, averaging at 37 minutes. Then, we’ve got Kilimanjaro Safaris at 33 minutes, Expedition Everest at 19 minutes, and TriceraTop Spin at 7 minutes.
Generally speaking, most wait times have remained about the same, except for those particularly popular rides! We’ll be back next week with even more wait time updates from Disney World, so be sure to check back with us!
You’ll Use the Items in Disney World’s New Collection Every Day!
Join the DFB Newsletter to get all the breaking news right in your inbox! Click here to Subscribe!
Don’t Miss Out on Any Disney Fun!
Order Your Copy of the 2021 DFB Guide to Walt Disney World Dining Today!
 With more than 750 pages, the 2021 DFB Guide to Walt Disney World Dining is full of tips and planning tools developed by Disney World experts over 30+ years of visits. We’ve done the research for you, so you’ll know just which spots will uniquely suit your family’s needs!
With mini-reviews of every single restaurant, bar, lounge, kiosk and more; an entire chapter on the best snacks in Disney World; full Disney Dining Plan analysis (and how to get FREE dining); and a full chapter on discounts and deals; you’ll have everything you need to plan your best vacation yet.
Click here to order your copy of the 2021 DFB Guide to Walt Disney World Dining E-book with code WDW2021 to save 25% off the cover price today!
Use code WDW2021 at check-out for 25% off the cover price today!

Our guides are backed by a 100% money-back guarantee, so you have nothing to lose. 
What’s your favorite Disney World ride? Tell us in the comments!
The post Wait Times Are on the RISE for Disney World’s Most Popular Rides! first appeared on the disney food blog.


