Week Ends With Low Crowds – Disney World Wait Times for Sunday, April 25, 2021

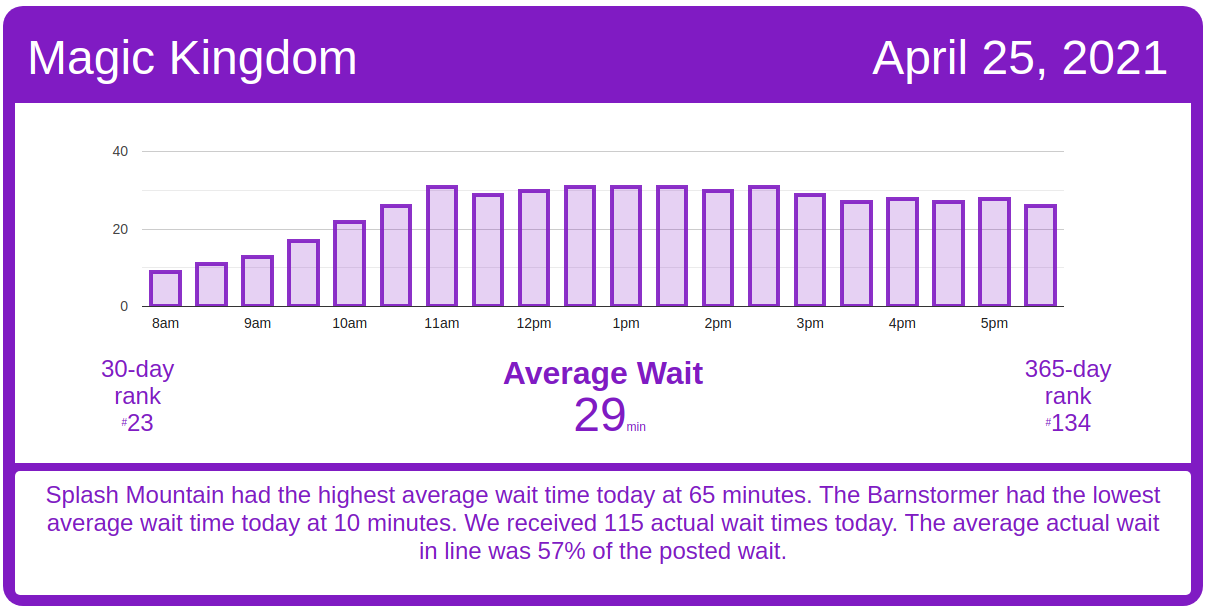
Crowds were light across all four Walt Disney World theme parks today, with no park’s average wait times higher than 23rd (Magic Kingdom) out of the past 30 days.  And even though Magic Kingdom’s average posted wait was 29 minutes, we got 115 actual wait times just from that park, and they were just 57% of the posted waits.  So a posted wait of 35 minutes at Splash Mountain was a 20-minute actual wait.

We received 208 actual wait times today. Let’s do the rest of the numbers!

Magic Kingdom Wait Times

Space Mountain had an average wait time today of 40 minutes. Its 7-day average is 43 minutes, so today ranks #5 for this week. Its 30-day average is 46 minutes, so today ranks #21 for the past month. Its 365-day average is 37 minutes, so today ranks #140 for the past year. We received 14 actual wait times today, and the actual wait averaged 64% of the posted wait time.

Magic Kingdom wait times for Sunday, April 25, 2021
Astro Orbiter
Average Posted Wait
35
7-Day Rank
#5
30-Day Rank
#22
365-Day Rank
#133
Big Thunder Mountain Railroad
Average Posted Wait
32
Actual Waits Were
31%
7-Day Rank
#5
30-Day Rank
#21
365-Day Rank
#223
Buzz Lightyear’s Space Ranger Spin
Average Posted Wait
27
Actual Waits Were
63%
7-Day Rank
#4
30-Day Rank
#25
365-Day Rank
#182
Prince Charming Regal Carrousel
Average Posted Wait
26
7-Day Rank
#1
30-Day Rank
#1
365-Day Rank
#1
Dumbo the Flying Elephant
Average Posted Wait
34
7-Day Rank
#1
30-Day Rank
#1
365-Day Rank
#1
“it’s a small world”
Average Posted Wait
28
Actual Waits Were
60%
7-Day Rank
#5
30-Day Rank
#28
365-Day Rank
#221
Jungle Cruise
Average Posted Wait
41
Actual Waits Were
76%
7-Day Rank
#5
30-Day Rank
#24
365-Day Rank
#149
Mad Tea Party
Average Posted Wait
14
7-Day Rank
#5
30-Day Rank
#24
365-Day Rank
#117
Mickey’s PhilharMagic
Average Posted Wait
33
7-Day Rank
#1
30-Day Rank
#4
365-Day Rank
#17
Peter Pan’s Flight
Average Posted Wait
35
7-Day Rank
#3
30-Day Rank
#20
365-Day Rank
#136
Pirates of the Caribbean
Average Posted Wait
37
Actual Waits Were
59%
7-Day Rank
#6
30-Day Rank
#25
365-Day Rank
#206
Space Mountain
Average Posted Wait
40
Actual Waits Were
64%
7-Day Rank
#5
30-Day Rank
#21
365-Day Rank
#140
Splash Mountain
Average Posted Wait
65
Actual Waits Were
71%
7-Day Rank
#3
30-Day Rank
#22
365-Day Rank
#87
The Barnstormer
Average Posted Wait
10
Actual Waits Were
53%
7-Day Rank
#6
30-Day Rank
#27
365-Day Rank
#206
The Haunted Mansion
Average Posted Wait
24
Actual Waits Were
38%
7-Day Rank
#5
30-Day Rank
#19
365-Day Rank
#172
The Magic Carpets of Aladdin
Average Posted Wait
15
7-Day Rank
#6
30-Day Rank
#28
365-Day Rank
#110
The Many Adventures of Winnie the Pooh
Average Posted Wait
28
Actual Waits Were
65%
7-Day Rank
#4
30-Day Rank
#16
365-Day Rank
#95
Tomorrowland Speedway
Average Posted Wait
11
Actual Waits Were
78%
7-Day Rank
#6
30-Day Rank
#28
365-Day Rank
#210
Seven Dwarfs Mine Train
Average Posted Wait
47
Actual Waits Were
58%
7-Day Rank
#6
30-Day Rank
#28
365-Day Rank
#206
Under the Sea ~ Journey of the Little Mermaid
Average Posted Wait
24
Actual Waits Were
32%
7-Day Rank
#4
30-Day Rank
#11
365-Day Rank
#117

Animal Kingdom Wait Times

Avatar Flight of Passage had an average wait time today of 56 minutes. Its 7-day average is 56 minutes, so today ranks #5 for this week. Its 30-day average is 68 minutes, so today ranks #27 for the past month. Its 365-day average is 50 minutes, so today ranks #128 for the past year. We received 6 actual wait times today, and the actual wait averaged 84% of the posted wait time.

Animal Kingdom wait times for Sunday, April 25, 2021
DINOSAUR
Average Posted Wait
45
Actual Waits Were
92%
7-Day Rank
#4
30-Day Rank
#17
365-Day Rank
#85
Expedition Everest – Legend of the Forbidden Mountain
Average Posted Wait
26
Actual Waits Were
71%
7-Day Rank
#1
30-Day Rank
#10
365-Day Rank
#113
Kali River Rapids
Average Posted Wait
17
7-Day Rank
#5
30-Day Rank
#22
365-Day Rank
#88
Kilimanjaro Safaris
Average Posted Wait
28
Actual Waits Were
50%
7-Day Rank
#6
30-Day Rank
#26
365-Day Rank
#92
It’s Tough to Be a Bug!
Average Posted Wait
29
7-Day Rank
#5
30-Day Rank
#20
365-Day Rank
#54
TriceraTop Spin
Average Posted Wait
9
7-Day Rank
#3
30-Day Rank
#17
365-Day Rank
#61
Na’vi River Journey
Average Posted Wait
38
Actual Waits Were
66%
7-Day Rank
#2
30-Day Rank
#18
365-Day Rank
#190
Avatar Flight of Passage
Average Posted Wait
56
Actual Waits Were
84%
7-Day Rank
#5
30-Day Rank
#27
365-Day Rank
#128

Hollywood Studios Wait Times

Star Tours: The Adventures Continue had an average wait time today of 24 minutes. Its 7-day average is 31 minutes, so today ranks #6 for this week. Its 30-day average is 33 minutes, so today ranks #29 for the past month. Its 365-day average is 28 minutes, so today ranks #193 for the past year. We received 5 actual wait times today, and the actual wait averaged 63% of the posted wait time.

Hollywood Studios wait times for Sunday, April 25, 2021

Rise of the Resistance is having another typical day – not great, not terrible. Rise started today by calling a couple of boarding groups at 8:30 AM, but followed that with a delay of calling more boarding groups until 8:45 AM.  Rise of the Resistance had another delay of around 30 minutes at boarding group 66 around 12:30 PM, and that seems to be it for delays today.  At its current pace, Rise of the Resistance should be able to get to around boarding group 170 tonight.

Rise of the Resistance boarding groups for Sunday, April 25, 2021
Muppet*Vision 3D
Average Posted Wait
26
7-Day Rank
#6
30-Day Rank
#30
365-Day Rank
#115
Rock ‘n’ Roller Coaster Starring Aerosmith
Average Posted Wait
33
7-Day Rank
#6
30-Day Rank
#28
365-Day Rank
#216
Star Tours: The Adventures Continue
Average Posted Wait
24
Actual Waits Were
63%
7-Day Rank
#6
30-Day Rank
#29
365-Day Rank
#193
The Twilight Zone Tower of Terror
Average Posted Wait
47
Actual Waits Were
109%
7-Day Rank
#5
30-Day Rank
#28
365-Day Rank
#170
Toy Story Mania!
Average Posted Wait
24
Actual Waits Were
87%
7-Day Rank
#6
30-Day Rank
#28
365-Day Rank
#201
Slinky Dog Dash
Average Posted Wait
59
Actual Waits Were
64%
7-Day Rank
#5
30-Day Rank
#25
365-Day Rank
#166
Alien Swirling Saucers
Average Posted Wait
27
7-Day Rank
#4
30-Day Rank
#19
365-Day Rank
#103
Mickey & Minnie’s Runaway Railway
Average Posted Wait
33
Actual Waits Were
85%
7-Day Rank
#6
30-Day Rank
#28
365-Day Rank
#282
Millennium Falcon: Smugglers Run
Average Posted Wait
48
Actual Waits Were
78%
7-Day Rank
#4
30-Day Rank
#24
365-Day Rank
#190

EPCOT Wait Times

Soarin’ had an average wait time today of 46 minutes. Its 7-day average is 50 minutes, so today ranks #5 for this week. Its 30-day average is 59 minutes, so today ranks #28 for the past month. Its 365-day average is 37 minutes, so today ranks #97 for the past year. We received 6 actual wait times today, and the actual wait averaged 58% of the posted wait time.

EPCOT wait times for Sunday, April 25, 2021
Gran Fiesta Tour Starring The Three Caballeros
Average Posted Wait
10
7-Day Rank
#1
30-Day Rank
#4
365-Day Rank
#109
Journey Into Imagination With Figment
Average Posted Wait
17
7-Day Rank
#1
30-Day Rank
#18
365-Day Rank
#87
Living with the Land
Average Posted Wait
17
7-Day Rank
#1
30-Day Rank
#2
365-Day Rank
#14
Mission: SPACE Orange
Average Posted Wait
44
7-Day Rank
#2
30-Day Rank
#18
365-Day Rank
#48
Soarin’
Average Posted Wait
46
Actual Waits Were
58%
7-Day Rank
#5
30-Day Rank
#28
365-Day Rank
#97
Spaceship Earth
Average Posted Wait
29
Actual Waits Were
39%
7-Day Rank
#5
30-Day Rank
#24
365-Day Rank
#63
Test Track
Average Posted Wait
51
7-Day Rank
#6
30-Day Rank
#27
365-Day Rank
#161
The Seas with Nemo & Friends
Average Posted Wait
14
7-Day Rank
#4
30-Day Rank
#26
365-Day Rank
#75
Frozen Ever After
Average Posted Wait
37
7-Day Rank
#7
30-Day Rank
#28
365-Day Rank
#172

The post Week Ends With Low Crowds – Disney World Wait Times for Sunday, April 25, 2021 appeared first on TouringPlans.com Blog.