Weekend off to slow start – Disney World wait times for Saturday, May 1, 2021


It was a slow Saturday across Walt Disney World, with none of the four parks’ posted wait times averaging higher than 24th out of the past 30 days.  TouringPlans researcher Chrissy and I spent the afternoon in the Magic Kingdom, testing “minimize walking” and “minimize waiting” touring plans for the same set of 12 attractions, running from 3 p.m. to 9 p.m.  We’ll have that write-up for you early in the week.  It was the first time in a while that I’ve been in the Magic Kingdom until close, and it was good to see the park that late.

I counted 456 of 500 guests (88%) wearing masks according to Disney’s guidelines in the Magic Kingdom today.  I think this is – by a wide margin – the lowest compliance we’ve seen in the parks.  Earlier in the pandemic, the mask non-compliance we’d see was typically someone walking and drinking at the same time.  Today it was a bit of everything else, too: pulling down masks completely to talk to friends while waiting in line, walking between attractions with masks lowered, and having masks not covering noses.  I don’t think Disney has enough staff to enforce this level of non-compliance.

Likewise, I think it’s safe to say that the social distancing markers in attraction queues are now irrelevant – they’re not being followed and they’re not being enforced, at least on the dozen attractions I was on today.  On different rides, the groups behind me were close enough to run into me a couple of times.  And inside Space Mountain the group in front of me was both maskless and not distancing, and that seems like it’s still a concern when more than half the country isn’t vaccinated.

We got 266 actual wait times today from our fabulous Lines community.  Let’s do the rest of the numbers!

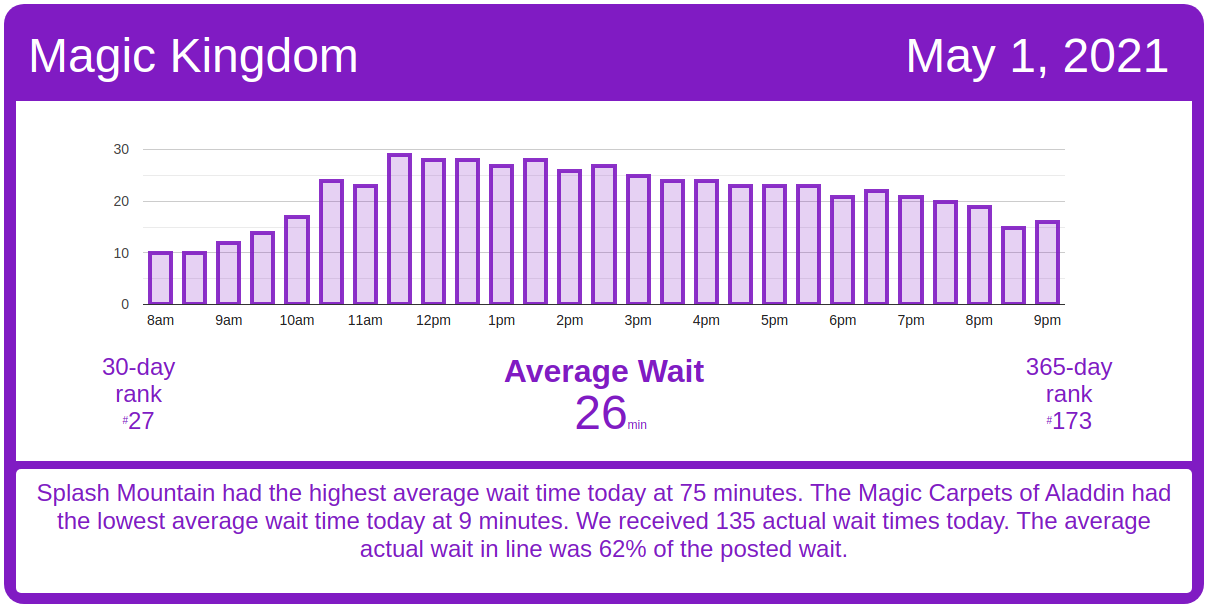
Magic Kingdom Wait Times

Tomorrowland Transit Authority PeopleMover had an average wait time today of 27 minutes. Its 7-day average is 27 minutes, so today ranks #3 for this week. Its 30-day average is 27 minutes, so today ranks #3 for the past month. Its 365-day average is 11 minutes, so today ranks #4 for the past year. We received 9 actual wait times today, and the actual wait averaged 77% of the posted wait time.

Magic Kingdom wait times for Saturday, May 1, 2021
Astro Orbiter
Average Posted Wait
30
7-Day Rank
#4
30-Day Rank
#26
365-Day Rank
#191
Big Thunder Mountain Railroad
Average Posted Wait
27
Actual Waits Were
22%
7-Day Rank
#4
30-Day Rank
#25
365-Day Rank
#259
Buzz Lightyear’s Space Ranger Spin
Average Posted Wait
24
Actual Waits Were
46%
7-Day Rank
#4
30-Day Rank
#26
365-Day Rank
#203
Prince Charming Regal Carrousel
Average Posted Wait
23
7-Day Rank
#1
30-Day Rank
#1
365-Day Rank
#1
Dumbo the Flying Elephant
Average Posted Wait
14
7-Day Rank
#5
30-Day Rank
#28
365-Day Rank
#139
“it’s a small world”
Average Posted Wait
27
7-Day Rank
#4
30-Day Rank
#26
365-Day Rank
#228
Jungle Cruise
Average Posted Wait
35
Actual Waits Were
63%
7-Day Rank
#6
30-Day Rank
#29
365-Day Rank
#207
Mad Tea Party
Average Posted Wait
13
7-Day Rank
#4
30-Day Rank
#25
365-Day Rank
#138
Mickey’s PhilharMagic
Average Posted Wait
26
7-Day Rank
#6
30-Day Rank
#28
365-Day Rank
#115
Peter Pan’s Flight
Average Posted Wait
28
Actual Waits Were
92%
7-Day Rank
#6
30-Day Rank
#29
365-Day Rank
#199
Pirates of the Caribbean
Average Posted Wait
37
Actual Waits Were
78%
7-Day Rank
#2
30-Day Rank
#18
365-Day Rank
#202
Space Mountain
Average Posted Wait
45
Actual Waits Were
82%
7-Day Rank
#1
30-Day Rank
#9
365-Day Rank
#109
Splash Mountain
Average Posted Wait
75
Actual Waits Were
68%
7-Day Rank
#1
30-Day Rank
#6
365-Day Rank
#45
The Barnstormer
Average Posted Wait
11
7-Day Rank
#3
30-Day Rank
#24
365-Day Rank
#207
The Haunted Mansion
Average Posted Wait
22
Actual Waits Were
52%
7-Day Rank
#3
30-Day Rank
#19
365-Day Rank
#199
The Magic Carpets of Aladdin
Average Posted Wait
9
7-Day Rank
#6
30-Day Rank
#29
365-Day Rank
#261
The Many Adventures of Winnie the Pooh
Average Posted Wait
19
Actual Waits Were
76%
7-Day Rank
#6
30-Day Rank
#29
365-Day Rank
#215
Tomorrowland Speedway
Average Posted Wait
11
Actual Waits Were
65%
7-Day Rank
#6
30-Day Rank
#30
365-Day Rank
#228
Tomorrowland Transit Authority PeopleMover
Average Posted Wait
27
Actual Waits Were
77%
7-Day Rank
#3
30-Day Rank
#3
365-Day Rank
#4
Walt Disney’s Carousel of Progress
Average Posted Wait
10
Actual Waits Were
58%
7-Day Rank
#1
30-Day Rank
#1
365-Day Rank
#1
Seven Dwarfs Mine Train
Average Posted Wait
48
Actual Waits Were
50%
7-Day Rank
#3
30-Day Rank
#24
365-Day Rank
#206
Under the Sea ~ Journey of the Little Mermaid
Average Posted Wait
18
Actual Waits Were
23%
7-Day Rank
#5
30-Day Rank
#26
365-Day Rank
#190

Animal Kingdom Wait Times

Na’vi River Journey had an average wait time today of 34 minutes. Its 7-day average is 37 minutes, so today ranks #4 for this week. Its 30-day average is 38 minutes, so today ranks #24 for the past month. Its 365-day average is 45 minutes, so today ranks #221 for the past year. We received 7 actual wait times today, and the actual wait averaged 83% of the posted wait time.

Animal Kingdom wait times for Saturday, May 1, 2021
DINOSAUR
Average Posted Wait
43
7-Day Rank
#1
30-Day Rank
#17
365-Day Rank
#101
Expedition Everest – Legend of the Forbidden Mountain
Average Posted Wait
24
Actual Waits Were
56%
7-Day Rank
#1
30-Day Rank
#14
365-Day Rank
#146
Kali River Rapids
Average Posted Wait
34
7-Day Rank
#1
30-Day Rank
#12
365-Day Rank
#32
Kilimanjaro Safaris
Average Posted Wait
32
Actual Waits Were
50%
7-Day Rank
#4
30-Day Rank
#20
365-Day Rank
#73
It’s Tough to Be a Bug!
Average Posted Wait
29
7-Day Rank
#5
30-Day Rank
#19
365-Day Rank
#59
TriceraTop Spin
Average Posted Wait
5
7-Day Rank
#5
30-Day Rank
#20
365-Day Rank
#103
Na’vi River Journey
Average Posted Wait
34
Actual Waits Were
83%
7-Day Rank
#4
30-Day Rank
#24
365-Day Rank
#221
Avatar Flight of Passage
Average Posted Wait
61
Actual Waits Were
87%
7-Day Rank
#1
30-Day Rank
#13
365-Day Rank
#104

Hollywood Studios Wait Times

Toy Story Mania! had an average wait time today of 29 minutes. Its 7-day average is 28 minutes, so today ranks #3 for this week. Its 30-day average is 29 minutes, so today ranks #16 for the past month. Its 365-day average is 27 minutes, so today ranks #123 for the past year. We received 4 actual wait times today, and the actual wait averaged 64% of the posted wait time.
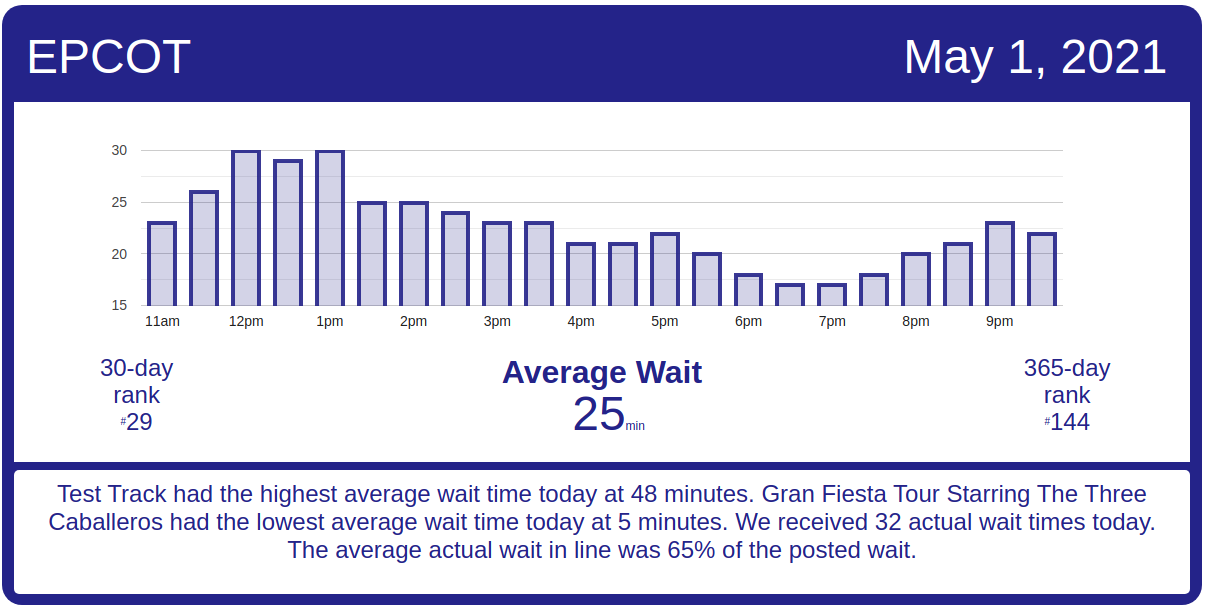
Hollywood Studios wait times for Saturday, May 1, 2021
Muppet*Vision 3D
Average Posted Wait
30
7-Day Rank
#4
30-Day Rank
#18
365-Day Rank
#80
Rock ‘n’ Roller Coaster Starring Aerosmith
Average Posted Wait
42
7-Day Rank
#1
30-Day Rank
#8
365-Day Rank
#145
Star Tours: The Adventures Continue
Average Posted Wait
27
7-Day Rank
#5
30-Day Rank
#27
365-Day Rank
#171
The Twilight Zone Tower of Terror
Average Posted Wait
55
Actual Waits Were
92%
7-Day Rank
#2
30-Day Rank
#14
365-Day Rank
#112
Toy Story Mania!
Average Posted Wait
29
Actual Waits Were
64%
7-Day Rank
#3
30-Day Rank
#16
365-Day Rank
#123
Slinky Dog Dash
Average Posted Wait
56
Actual Waits Were
55%
7-Day Rank
#5
30-Day Rank
#26
365-Day Rank
#185
Alien Swirling Saucers
Average Posted Wait
29
7-Day Rank
#2
30-Day Rank
#14
365-Day Rank
#89
Mickey & Minnie’s Runaway Railway
Average Posted Wait
35
Actual Waits Were
85%
7-Day Rank
#4
30-Day Rank
#22
365-Day Rank
#279
Millennium Falcon: Smugglers Run
Average Posted Wait
45
Actual Waits Were
78%
7-Day Rank
#4
30-Day Rank
#27
365-Day Rank
#211
Lightning McQueen’s Racing Academy
Average Posted Wait
23
7-Day Rank
#5
30-Day Rank
#26
365-Day Rank
#132

EPCOT Wait Times

Soarin’ had an average wait time today of 46 minutes. Its 7-day average is 51 minutes, so today ranks #5 for this week. Its 30-day average is 56 minutes, so today ranks #27 for the past month. Its 365-day average is 37 minutes, so today ranks #102 for the past year. We received 9 actual wait times today, and the actual wait averaged 48% of the posted wait time.

EPCOT wait times for Saturday, May 1, 2021
Gran Fiesta Tour Starring The Three Caballeros
Average Posted Wait
5
7-Day Rank
#6
30-Day Rank
#27
365-Day Rank
#278
Journey Into Imagination With Figment
Average Posted Wait
9
7-Day Rank
#6
30-Day Rank
#29
365-Day Rank
#191
Living with the Land
Average Posted Wait
11
7-Day Rank
#4
30-Day Rank
#21
365-Day Rank
#135
Mission: SPACE Orange
Average Posted Wait
38
7-Day Rank
#6
30-Day Rank
#27
365-Day Rank
#87
Soarin’
Average Posted Wait
46
Actual Waits Were
48%
7-Day Rank
#5
30-Day Rank
#27
365-Day Rank
#102
Spaceship Earth
Average Posted Wait
24
Actual Waits Were
37%
7-Day Rank
#5
30-Day Rank
#28
365-Day Rank
#103
Test Track
Average Posted Wait
48
Actual Waits Were
70%
7-Day Rank
#4
30-Day Rank
#27
365-Day Rank
#184
The Seas with Nemo & Friends
Average Posted Wait
14
7-Day Rank
#5
30-Day Rank
#26
365-Day Rank
#89
Frozen Ever After
Average Posted Wait
31
Actual Waits Were
99%
7-Day Rank
#6
30-Day Rank
#29
365-Day Rank
#207

The post Weekend off to slow start – Disney World wait times for Saturday, May 1, 2021 appeared first on TouringPlans.com Blog.