

The holidays are in full swing at Disney World and now we’re back with another look at the wait times!
It’s the holiday season in Disney World!
While the week of Thanksgiving brought high crowds, the week following the holiday was much quieter, although Disney World wasn’t exactly empty. And now that we’re getting closer to Christmas, have the wait times started to increase yet? Let’s find out!
If you don’t want to wait in traditional ride standby lines, Genie+ is the best way to get around that. But unlike the now discontinued FastPass system, Genie+ will cost you anywhere between $15 and $29 per person, per day (or more), depending on the day. That’s an expensive investment that can add up fast!

Using Disney Genie+!
With the purchase of Genie+, you get to use Lightning Lanes instead of standby lines, and you can save quite a bit of time by avoiding long wait times. But as you’re deciding whether or not Genie+ would work for you or your group, we recommend taking a look at ride wait times.

Splash Mountain Lightning Lane
The best way to do this is to make a list of all your favorite rides, and then as you scroll down you can check out their average wait times during this past week. If most of your rides have high wait times, Genie+ may be a good option. Scroll down for all the average wait times of every Disney World ride this past week.
Magic Kingdom
Let’s begin with Magic Kingdom, where Seven Dwarfs Mine Train had the longest average wait time at 67 minutes! It averaged 64 minutes last week, so that’s a bit of an increase.
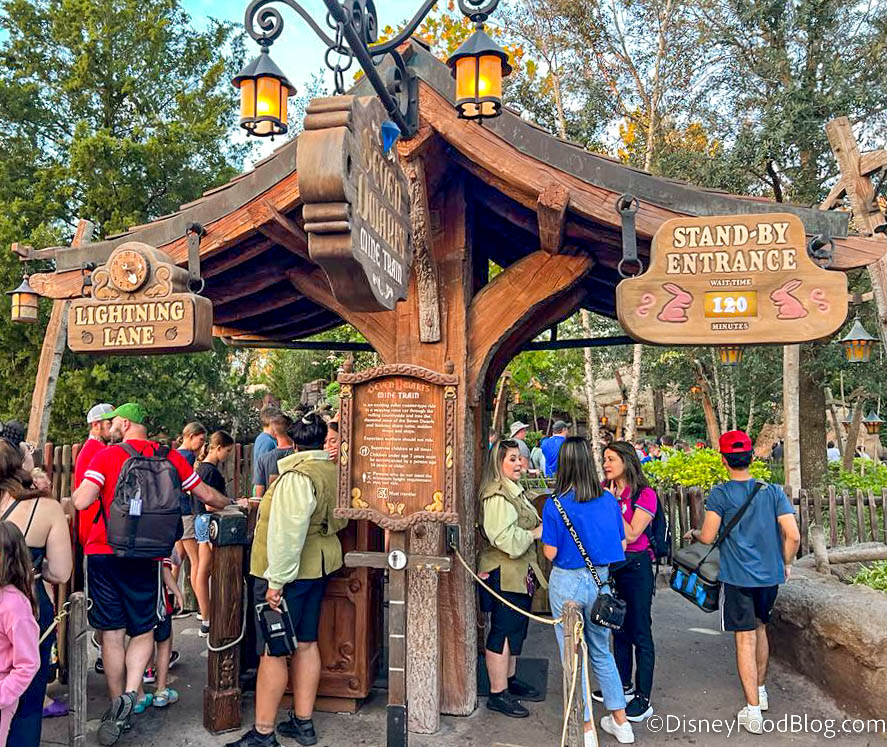
Seven Dwarfs Mine Train
Next, Jungle/Jingle Cruise averaged 60 minutes and Peter Pan’s Flight averaged 57 minutes. After that, the ride averages put Haunted Mansion at 40 minutes, Space Mountain at 36 minutes, Buzz Lightyear’s Space Ranger Spin at 32 minutes, Big Thunder Mountain Railroad at 32 minutes, Splash Mountain at 32 minutes, Pirates of the Caribbean at 26 minutes, and the Many Adventures of Winnie the Pooh at 26 minutes.
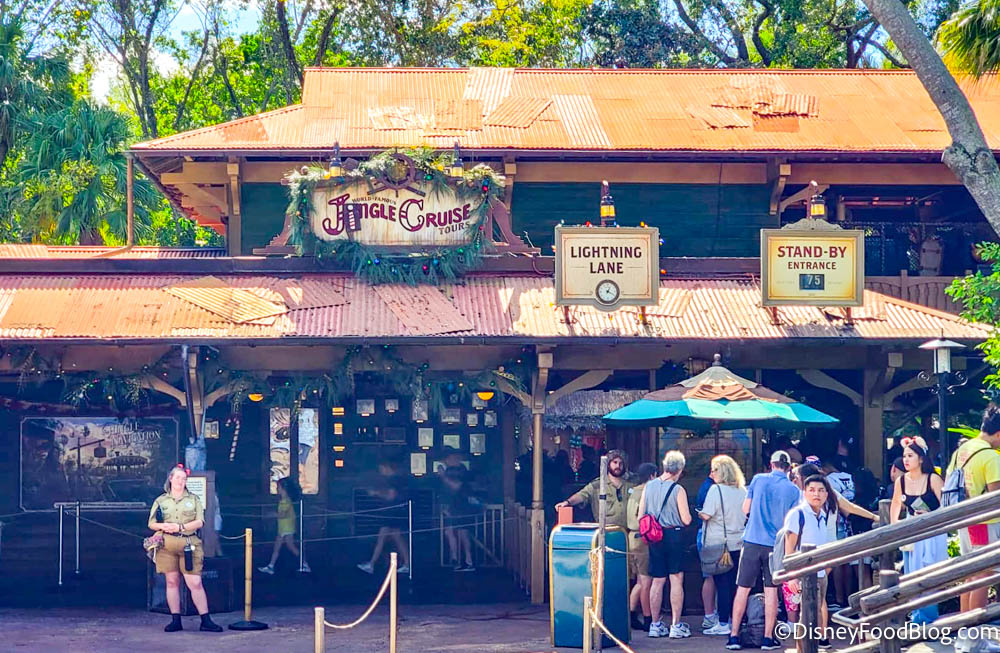
Jingle Cruise
After that, the Astro Orbiter averaged 23 minutes, “it’s a small world” averaged 21 minutes, Under the Sea – Journey of the Little Mermaid averaged 19 minutes, and Magic Carpets of Aladdin averaged 16 minutes. The Barnstormer featuring the Great Goofini, Dumbo the Flying Elephant, Tomorrowland Speedway, and Prince Charming Regal Carrousel all averaged 14 minutes.
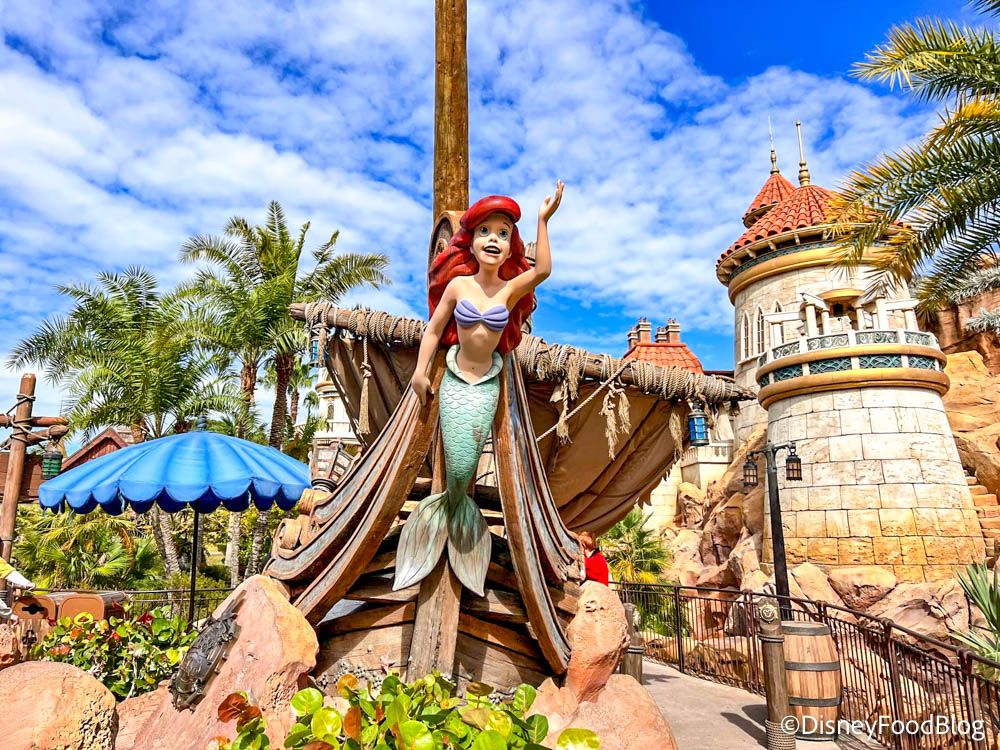
Journey of the Little Mermaid
Next, Mickey’s PhilharMagic averaged 12 minutes and the Mad Tea Party averaged 11 minutes. The Enchanted Tiki Room, the Carousel of Progress, the Swiss Family Robinson Treehouse, and the Liberty Square Riverboat all averaged 5 minutes.
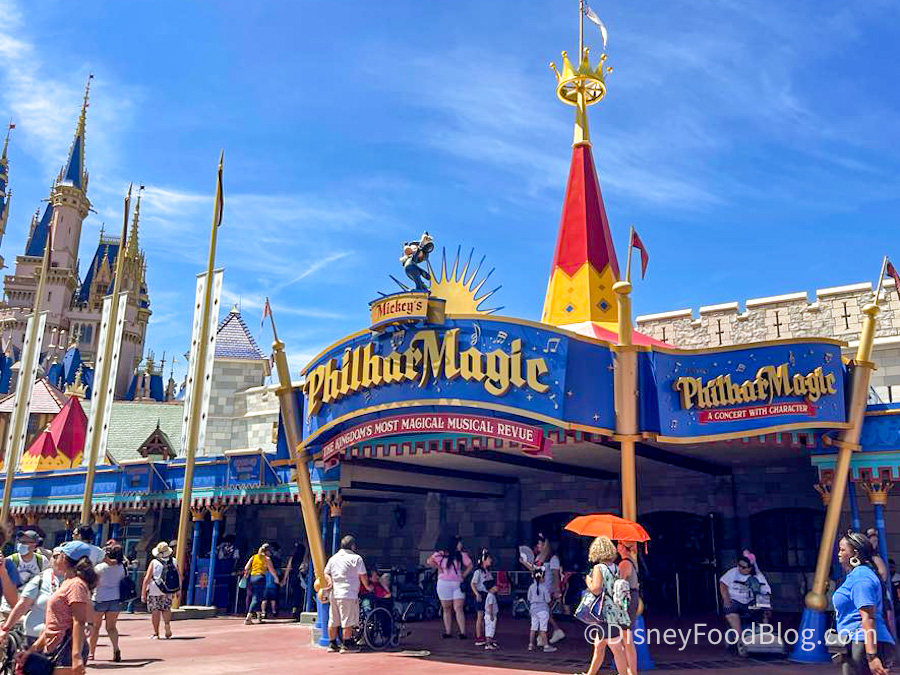
Mickey’s PhilharMagic
The Hall of Presidents averaged a wait time of 1 minute, while the Country Bear Jamboree and Tom Sawyer Island averaged no wait.
5 places to escape in Magic Kingdom when your anxiety is through the roof!
EPCOT
Over in EPCOT, the ride with the longest average wait time was Remy’s Ratatouille Adventure, with an average wait time of 79 minutes, compared to last week’s average of 71 minutes. Frozen Ever After had an average wait time of 73 minutes, which was an increase from last week’s average of 64 minutes.
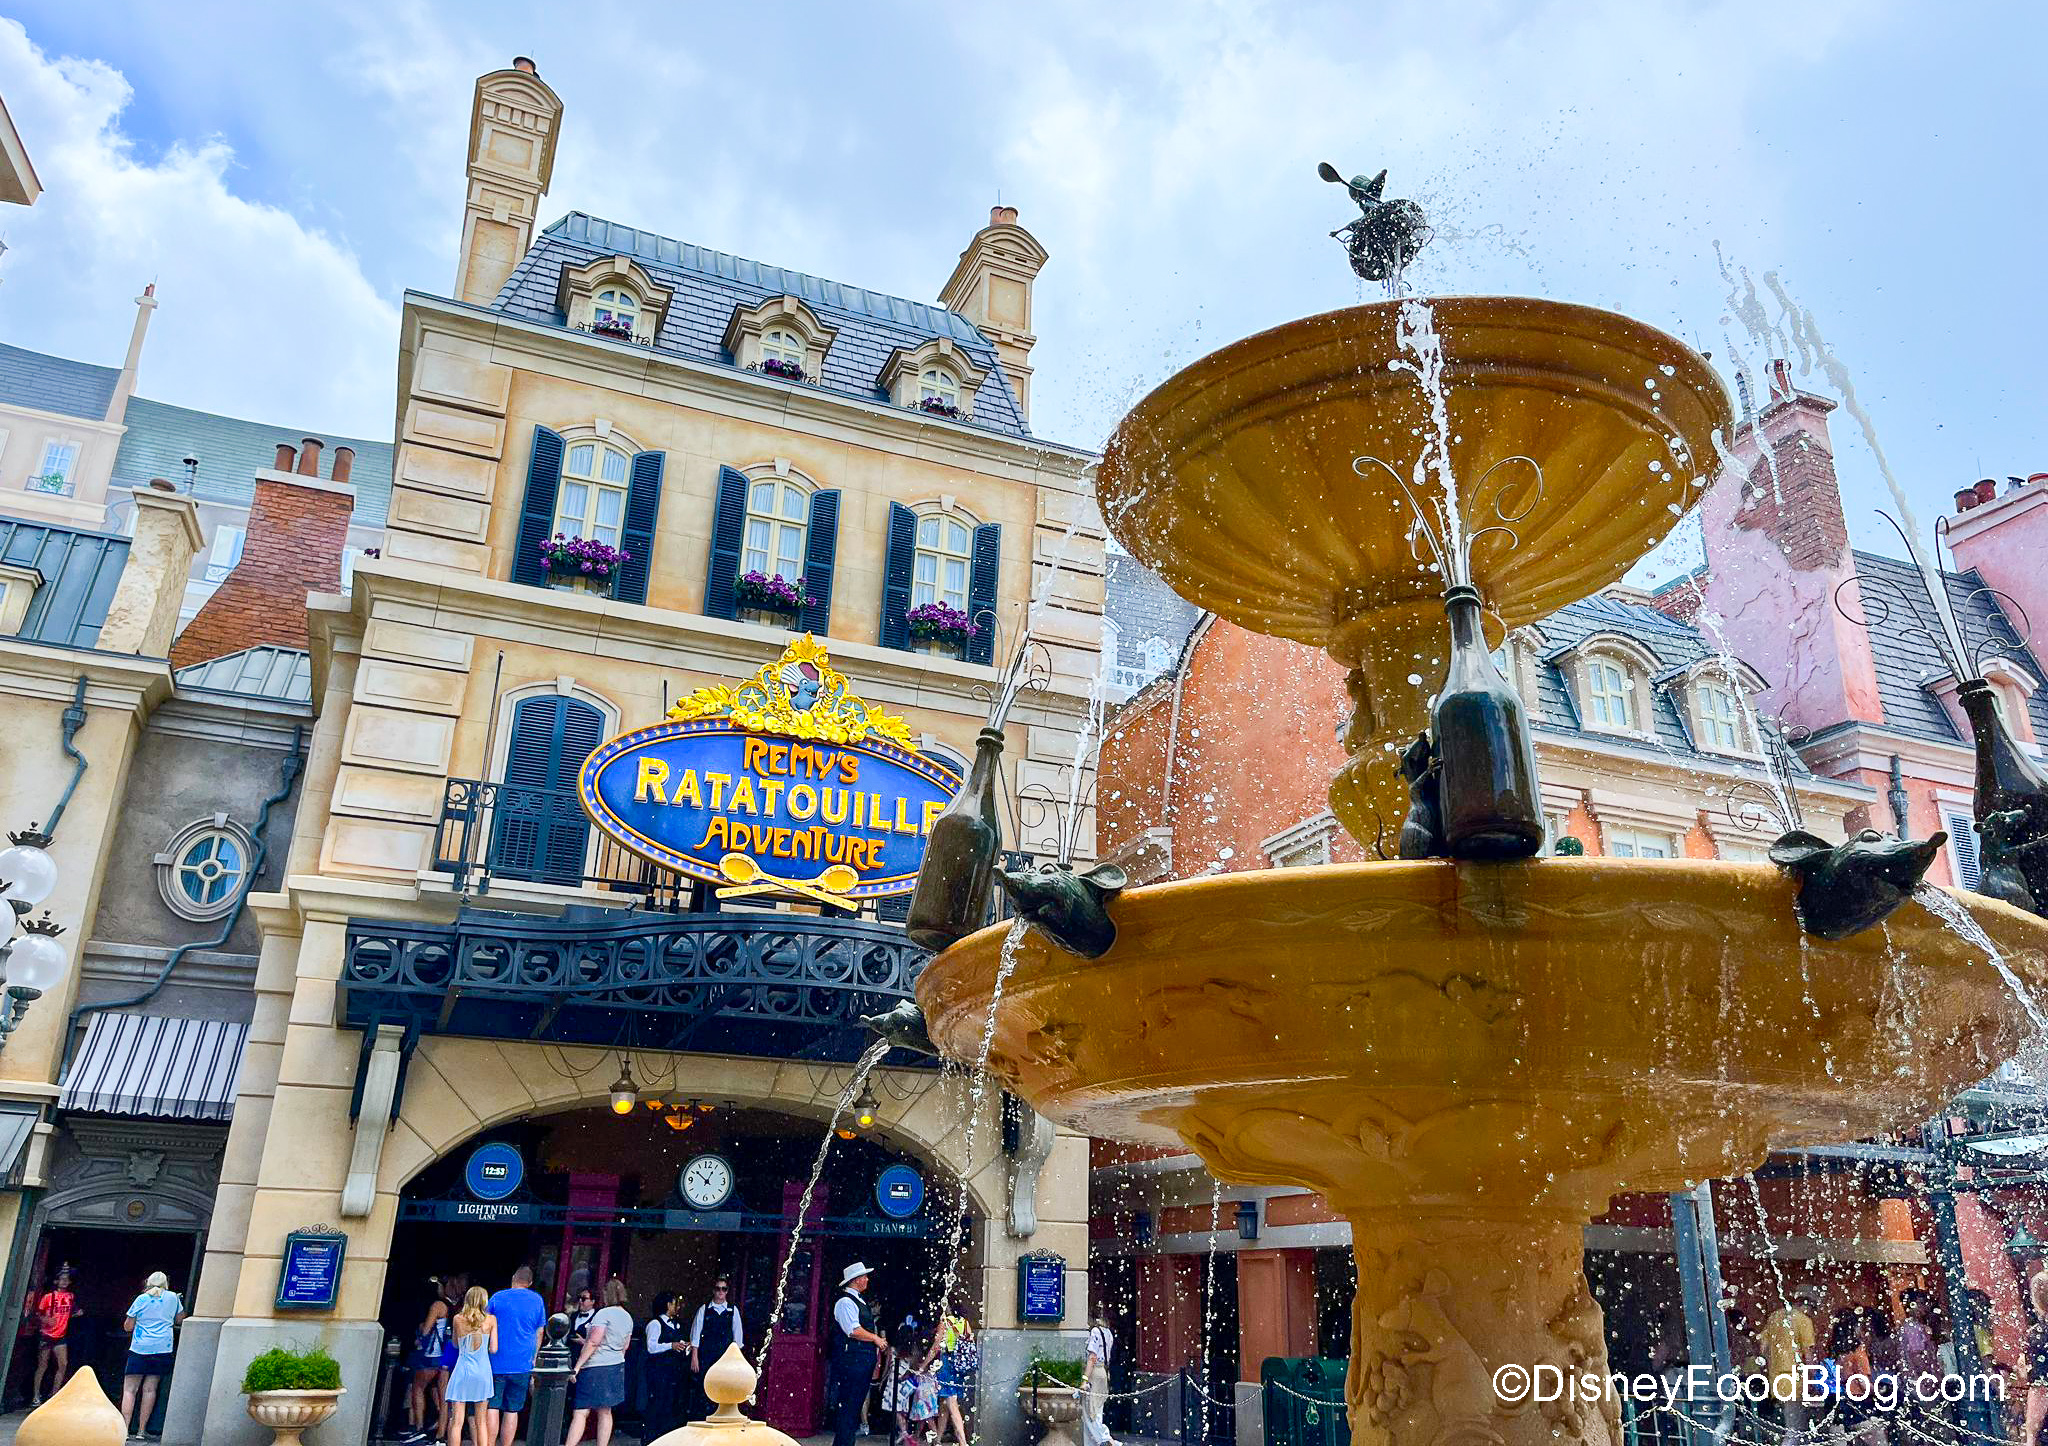
Remy’s Ratatouille Adventure
Next, we have Test Track at 55 minutes and Soarin’ at 41 minutes, and Spaceship Earth at 15 minutes. Mission: SPACE, Living with the Land, and The Seas with Nemo and Friends all averaged 13 minutes.
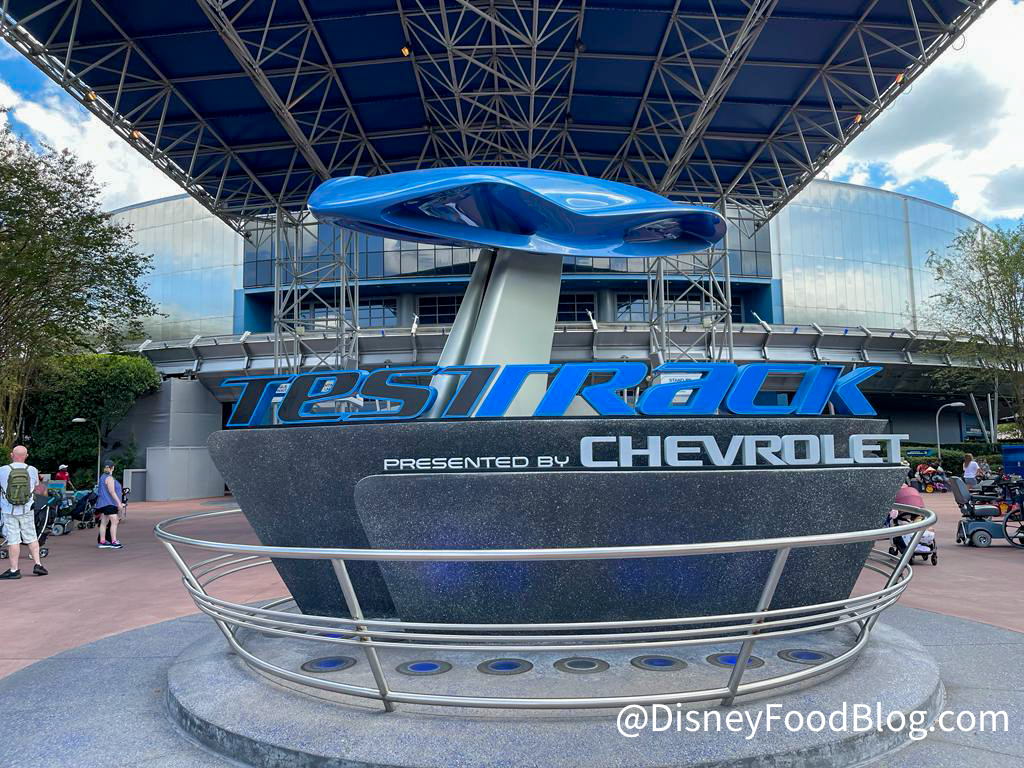
Test Track
Turtle Talk with Crush averaged 12 minutes, and Journey into Imagination and Gran Fiesta Tour averaged 11 minutes.

Journey into Imagination with Figment
Awesome Planet, Beauty and the Beast Sing-Along, Disney and Pixar Short Film Festival, Impressions de France, and Reflections of China had no wait times this week.
See the HUGE addition to the new Moana attraction in EPCOT!
Hollywood Studios
Now let’s take a trip over to Hollywood Studios where for the fourth week in a row, Tower of Terror topped the list with an average wait time of 98 minutes, compared to last week’s average of 94 minutes. Rise of the Resistance came in second place with an average of 93 minutes, while Slinky Dog Dash took third place with an average of 88 minutes.

Tower of Terror
Next, Mickey and Minnie’s Runaway Railway averaged 66 minutes, Toy Story Mania averaged 64 minutes, Millennium Falcon: Smugglers Run averaged 60 minutes, and Rock ‘n’ Roller Coaster featuring Aerosmith averaged 59 minutes.
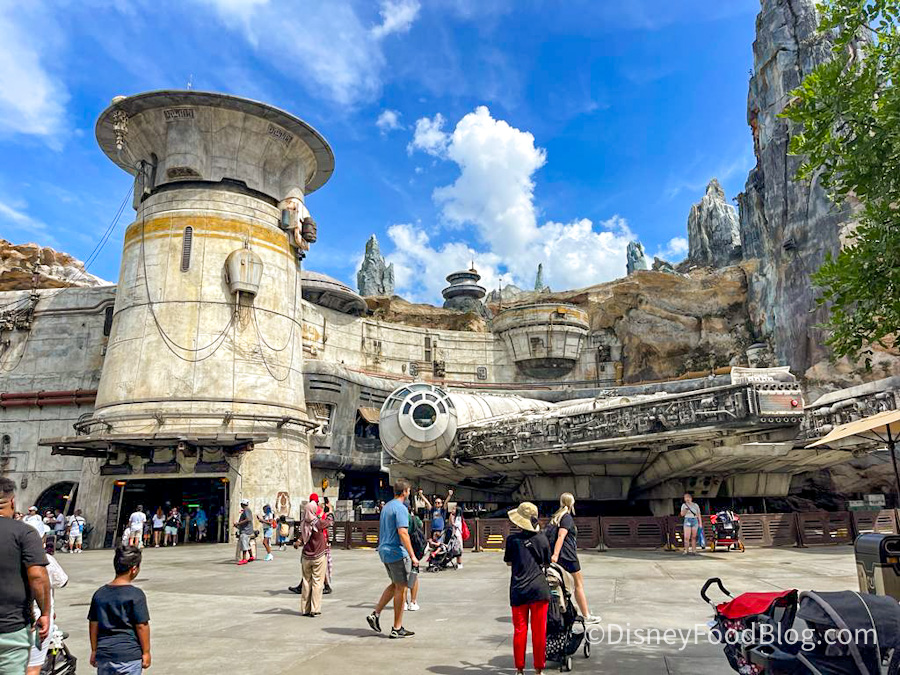
Millennium Falcon: Smuggler’s Run
After that, Alien Swirling Saucers averaged 36 minutes, Star Tours – The Adventures Continue averaged 18 minutes, Walt Disney Presents averaged 17 minutes, Lightning McQueen’s Racing Academy averaged 14 minutes, and Muppet*Vision 3D averaged 10 minutes.
22,000 fans rank all the rides in Disney’s Hollywood Studios!
Animal Kingdom
Finally, let’s visit Animal Kingdom, where Avatar Flight of Passage had the longest average wait time of 102 minutes. Last week, the average was 85 minutes.
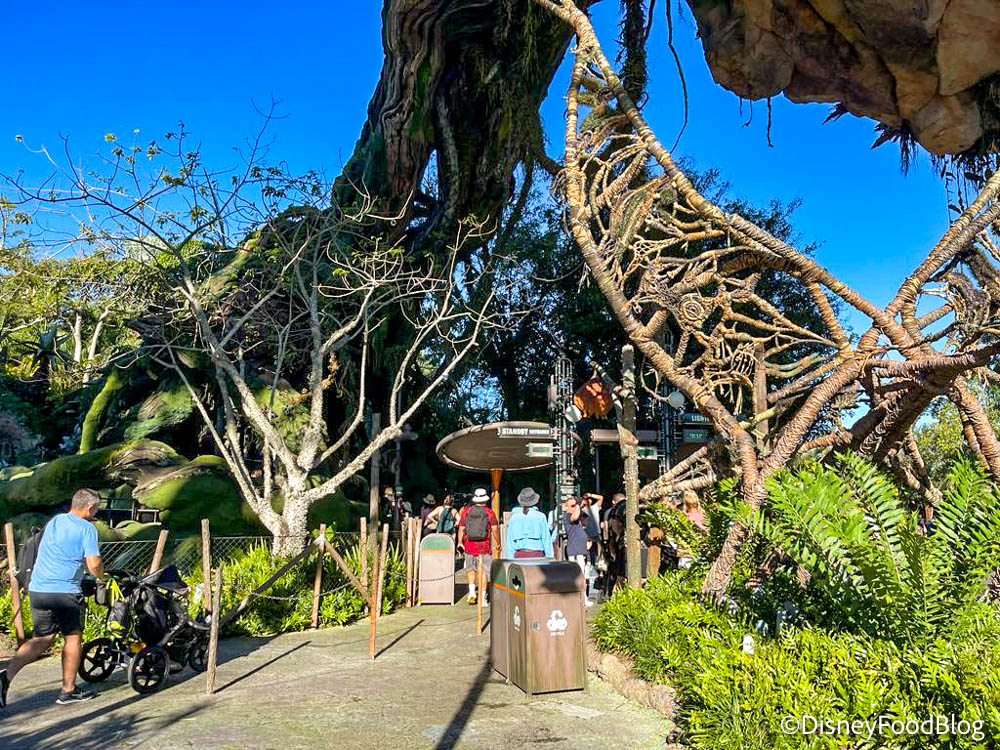
Flight of Passage
Next up was Na’vi River Journey at 64 minutes, Kilimanjaro Safaris at 58 minutes, Expedition Everest at 27 minutes, DINOSAUR at 16 minutes, and Kali River Rapids at 14 minutes.
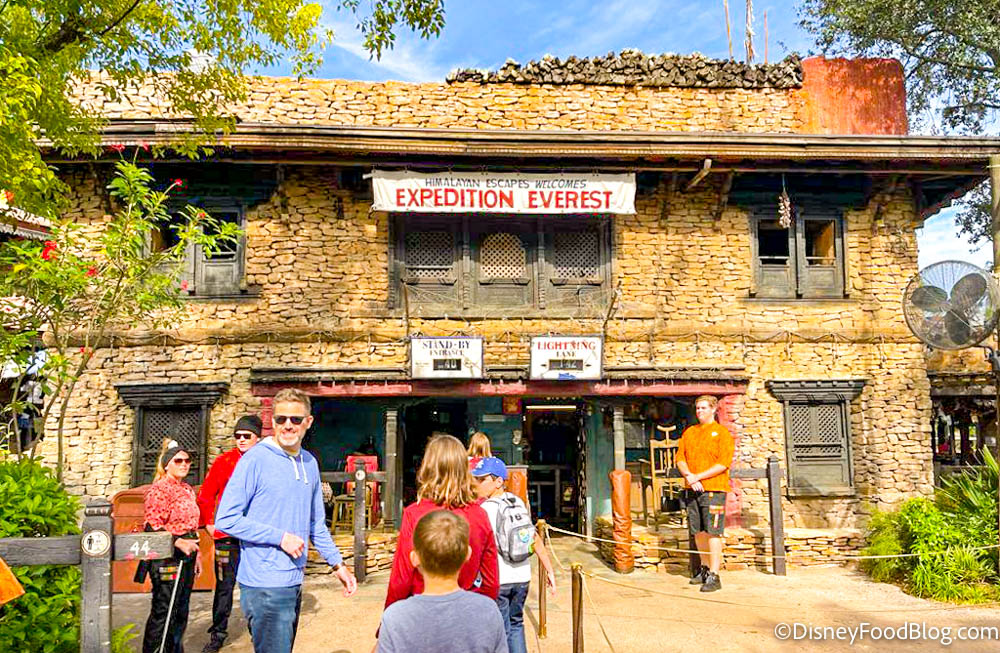
Expedition Everest
It’s Tough to Be a Bug averaged 12 minutes and Triceratop Spin averaged 10 minutes. Both The Boneyard and Gorilla Falls Exploration Trail averaged no wait time.
The five best rides at Animal Kingdom — and the five worst!
Overall, wait times slightly increased this week, which is to be expected as we get closer to Christmas. If you’re planning a visit to Disney World soon, you might want to consider getting Genie+ as wait times continue to increase.
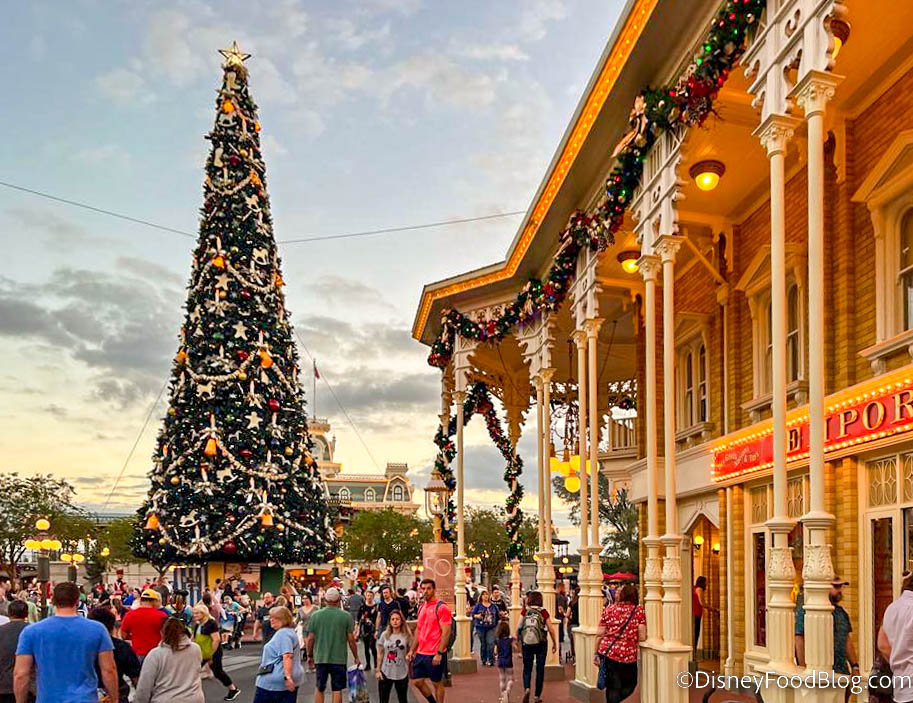
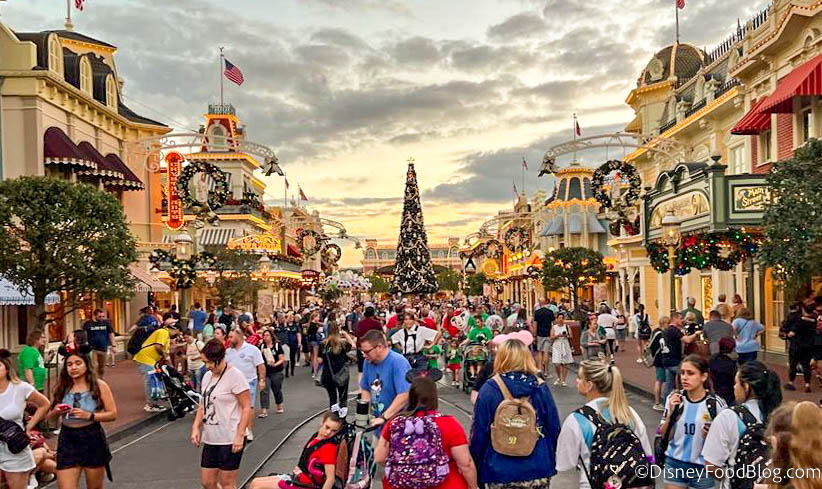
Christmas in Magic Kingdom
Keep following DFB for more Disney World news and updates!
Find out why it will cost you MORE to Park Hop in 2023!
Planning a Trip to Disney World? We’ve Got Everything You Need to Know
-
Tips, Hints, Lists, and Videos for Planning the BEST Disney World Trip
-
5 Simple Planning Tips You Need to Know About Before Your Next Disney World Trip
-
EVERYTHING You Need to Know Before Booking a 2023 Disney World Trip
Join the DFB Newsletter to Get All the Latest Disney News Delivered Right to Your Inbox Click Here to Subscribe
What’s your favorite ride in Disney World? Let us know in the comments!
The post What Wait Times Really Look Like in Disney World in December first appeared on the disney food blog.