

We have to warn you about something in Disney World.
Magic Kingdom
There are so many aspects that go into planning a trip — the hotel, the travel, the tickets, the dining reservations, and MORE. So it is our duty to let you know about what’s going on with Disney World wait times right now!
Average wait times are on the rise in most parks, but if you’re headed to Magic Kingdom soon, we have good news. Wait times are relatively low and averages went DOWN at many popular rides this week!
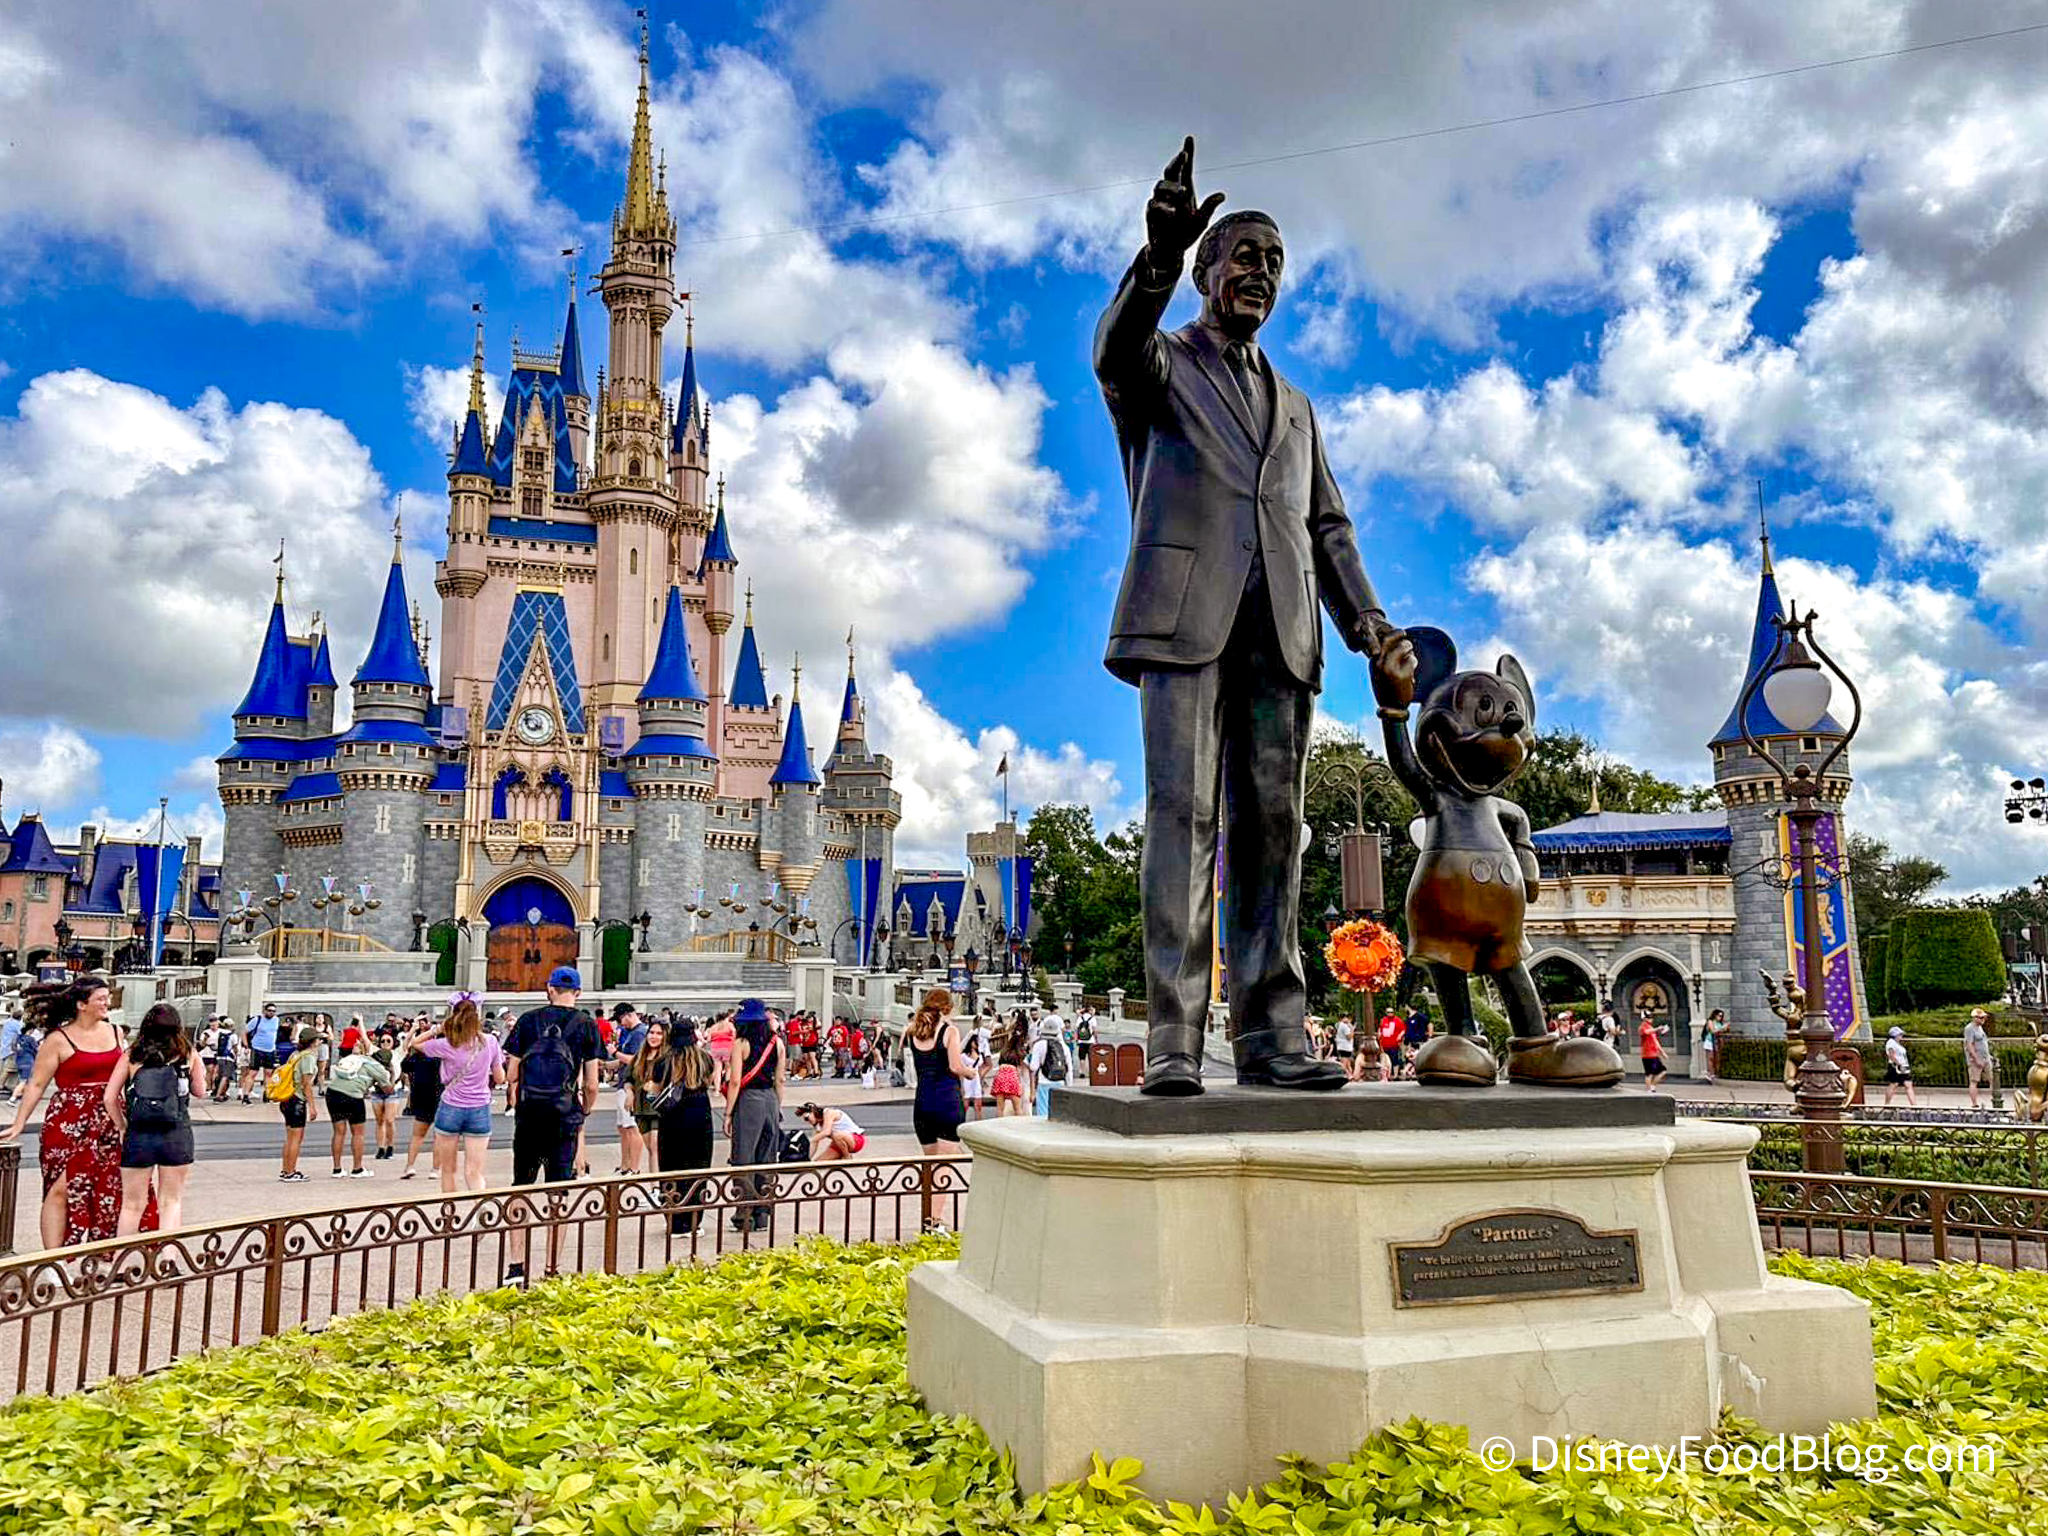
Cinderella Castle
We’ve noticed on days that the parks close early for Mickey’s Not-So-Scary Halloween Party, wait times have been pretty low throughout the day. Although it is not the best idea if you have a 1-park per day ticket, you might want to go to Magic Kingdom on one of these days if you are able to park hop when it closes.
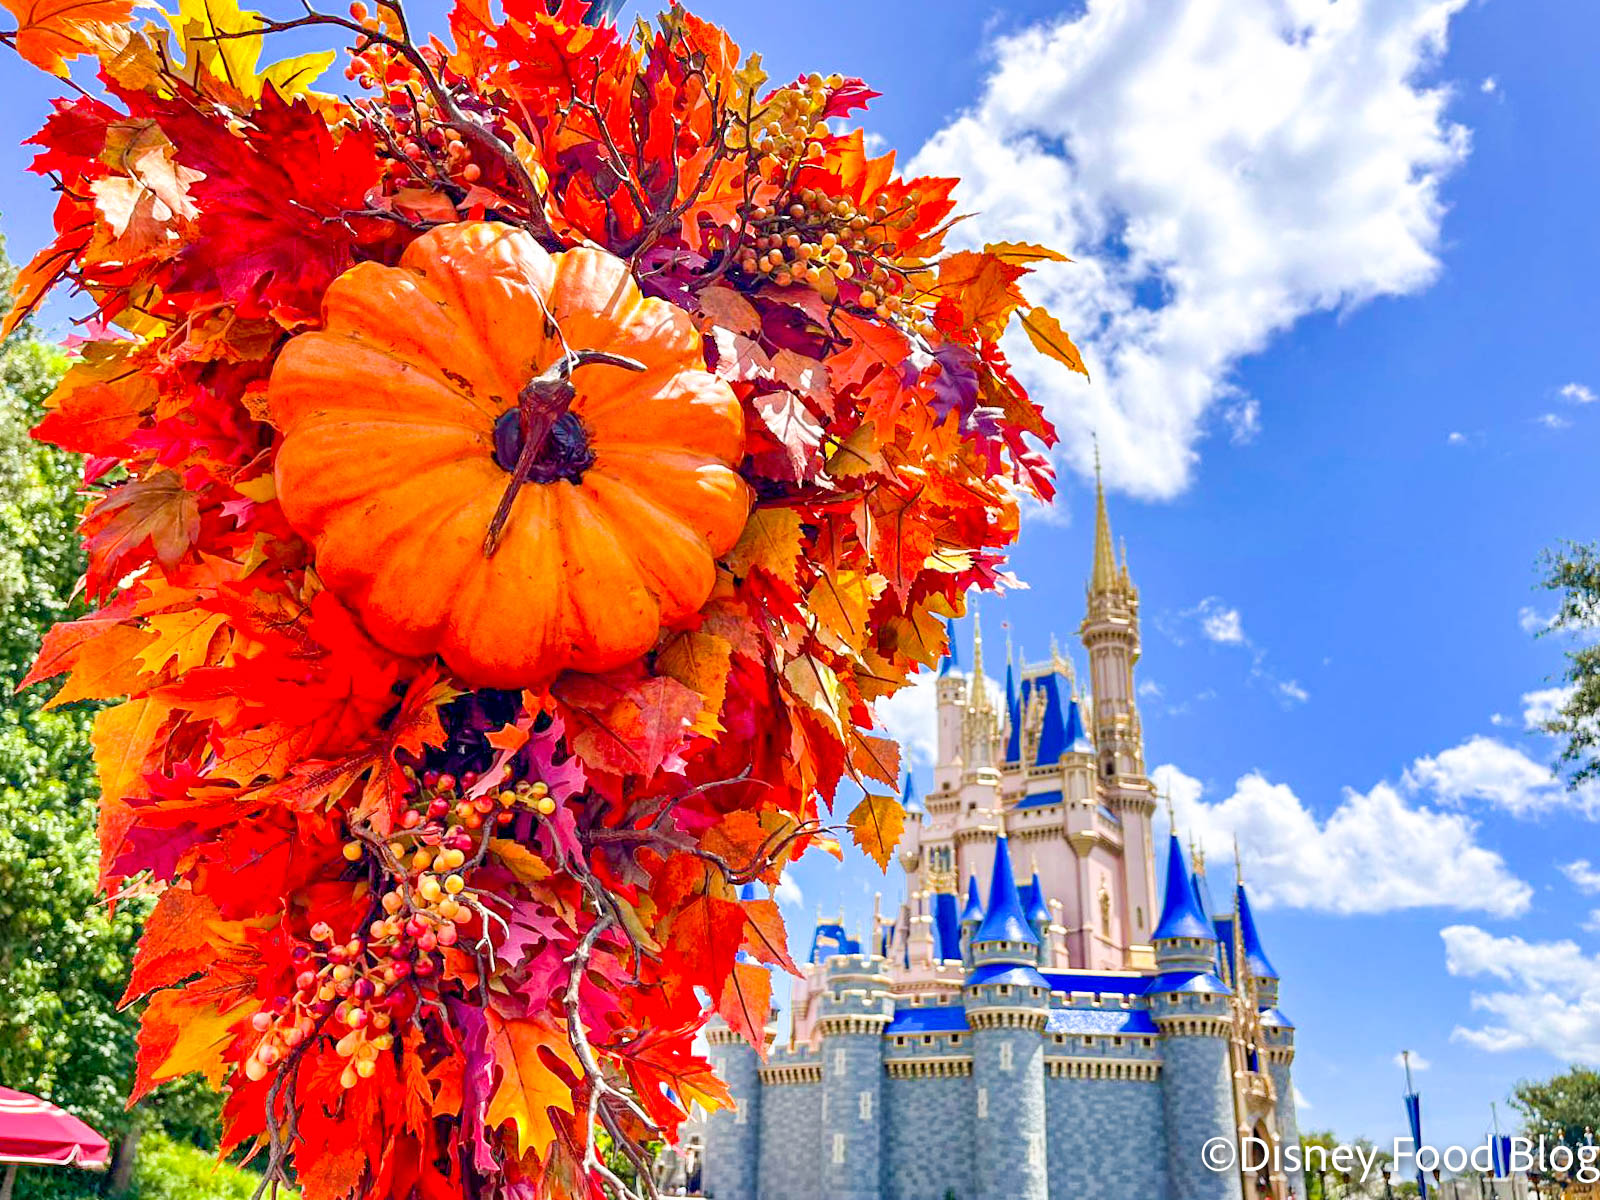
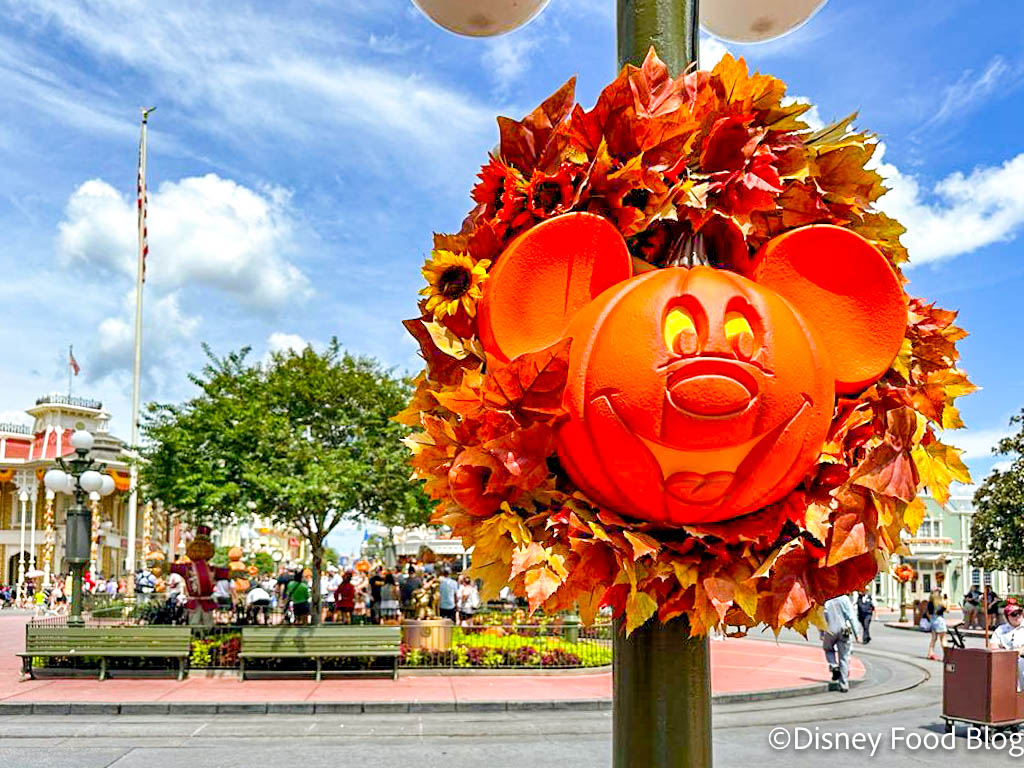
Happy Halloween Season!
It is the only park to have every ride with an average under 60 minutes this week, which is uncommon! Take a look at all of the average wait times from the past week below.
Magic Kingdom
Starting in Magic Kingdom, Seven Dwarfs Mine Train had the longest average wait time of 55 minutes. Last week the average wait time was 57 minutes so the average has decreased a little bit.
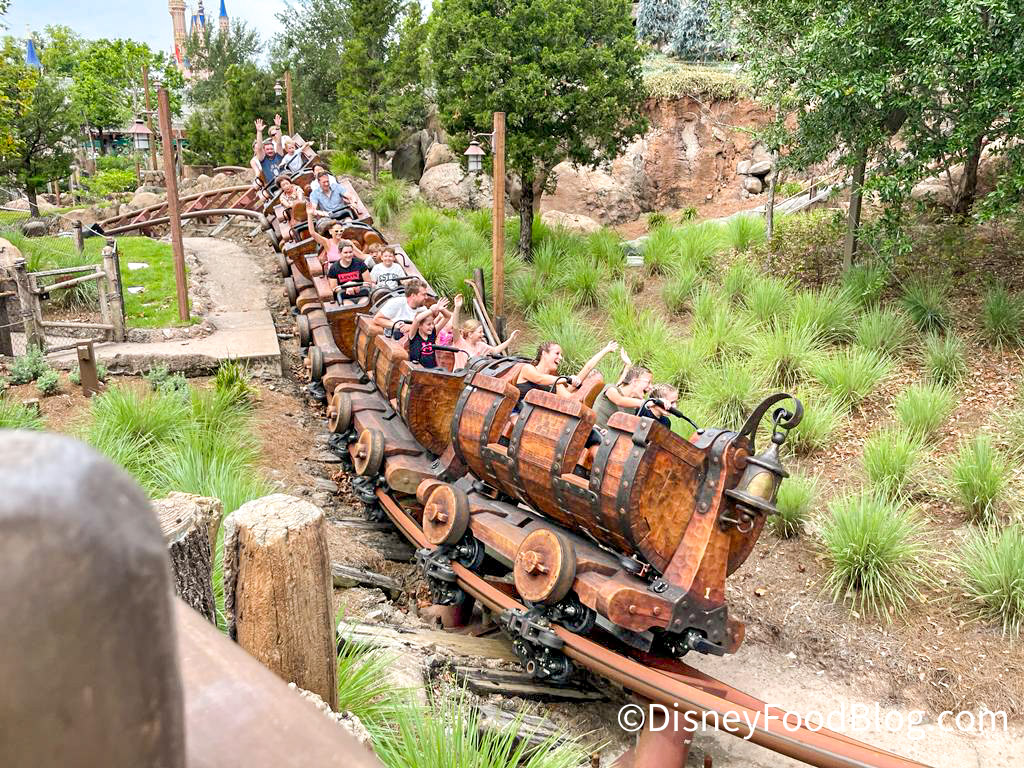
Seven Dwarfs Mine Train
Next, Peter Pan’s Flight averaged 52 minutes, Space Mountain averaged 35 minutes, and Jungle Cruise averaged 36 minutes. Average wait times held Haunted Mansion at 36 minutes, The Many Adventures of Winnie the Pooh at 24 minutes, Pirates of the Caribbean at 23 minutes, Buzz Lightyear’s Space Ranger Spin at 22 minutes, Enchanted Tales with Belle at 21 minutes, and Big Thunder Mountain Railroad at 20 minutes, followed by Astro Orbiter at 16 minutes.

Big Thunder Mountain Railroad
After that, Tomorrowland Speedway averaged 14 minutes, Mickey’s PhilharMagic at 14 minutes, closely followed by “it’s a small world” and Tomorrowland Transit Authority PeopleMover which averaged 13 minutes each. Barnstormer featuring the Great Goofini and Under the Sea – Journey of the Little Mermaid averaged 9 minutes, Magic Carpets of Aladdin averaged 8 minutes, Dumbo the Flying Elephant averaged 7 minutes, and Mad Tea Party averaged 6 minutes.
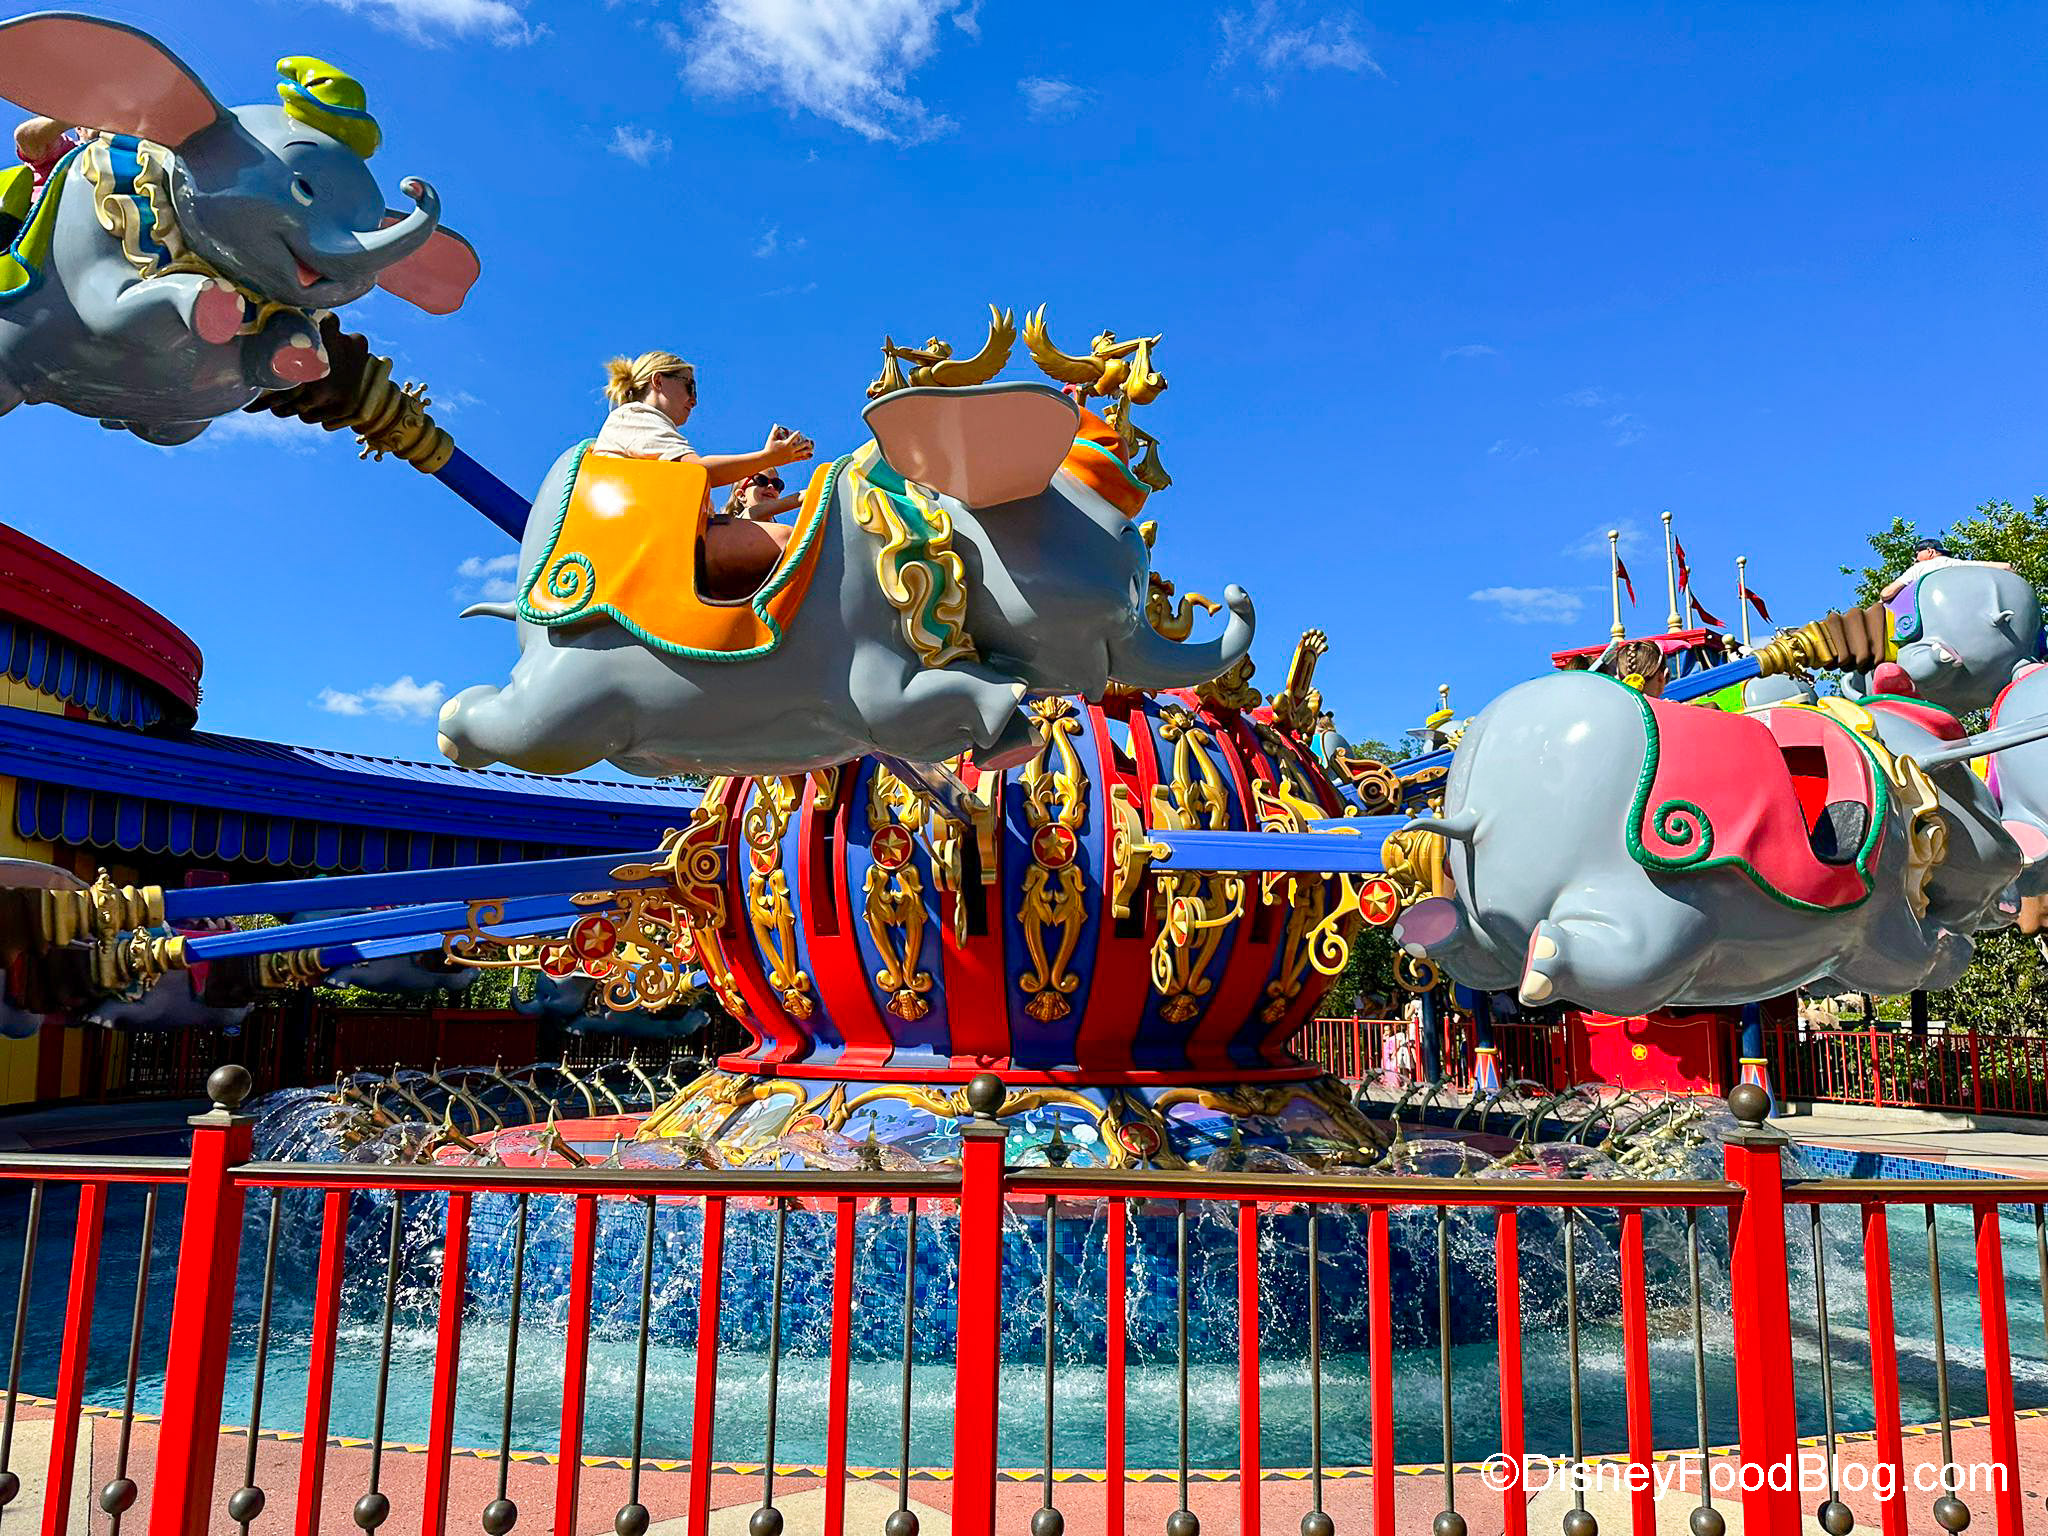
Dumbo
Prince Charming Regal Carrousel averaged 5 minutes and other attractions like Enchanted Tiki Room, Hall of Presidents, Swiss Family Robinson Treehouse, Carousel of Progress, and Liberty Square Riverboat all tied at 5-minute average wait times.
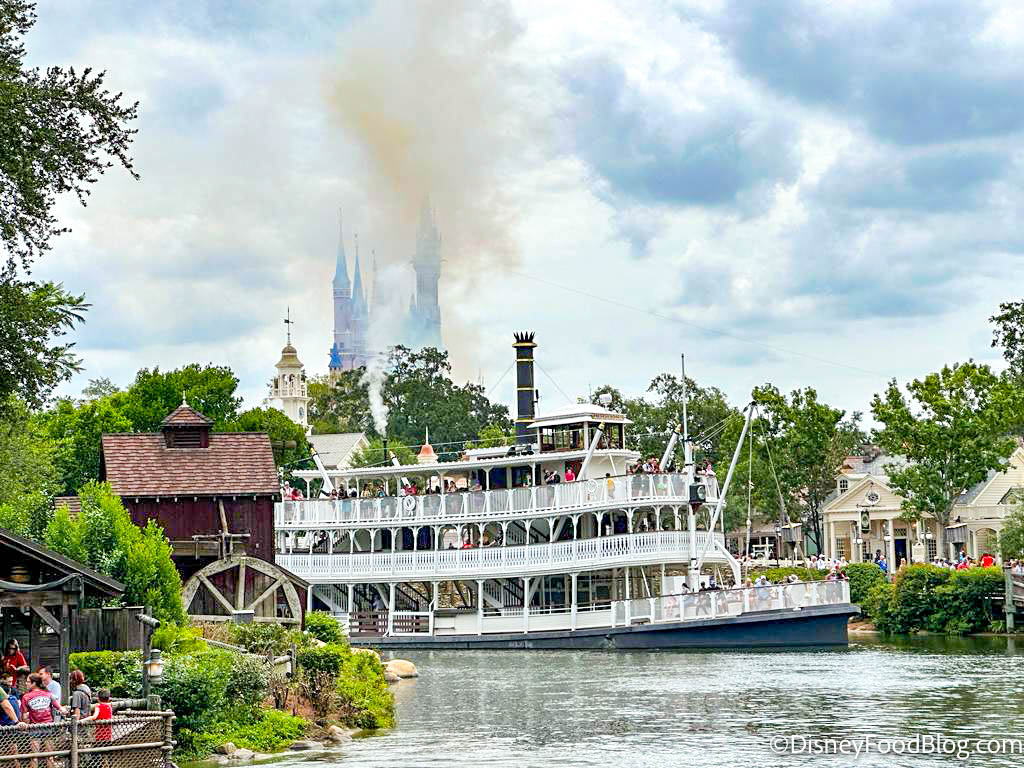
Riverboat
The Country Bear Jamboree and Tom Sawyer Island were walk-ons this week.
Please DON’T Bring These 8 Things to Magic Kingdom
EPCOT
Heading over to EPCOT, Frozen Ever After has the spot for the longest wait time in the park with a 64-minute average. This is an increase from last week’s 58-minute average. Remy’s Ratatouille Adventure was the next highest with a 55-minute average which also increased since the previous week.

Frozen Ever After
Next up is Test Track at 45 minutes, Soarin’ at 39 minutes, Turtle Talk with Crush at 16 minutes, Mission: SPACE and Journey into Imagination at 13 minutes, and Spaceship Earth and The Seas with Nemo and Friends at 10 minutes.
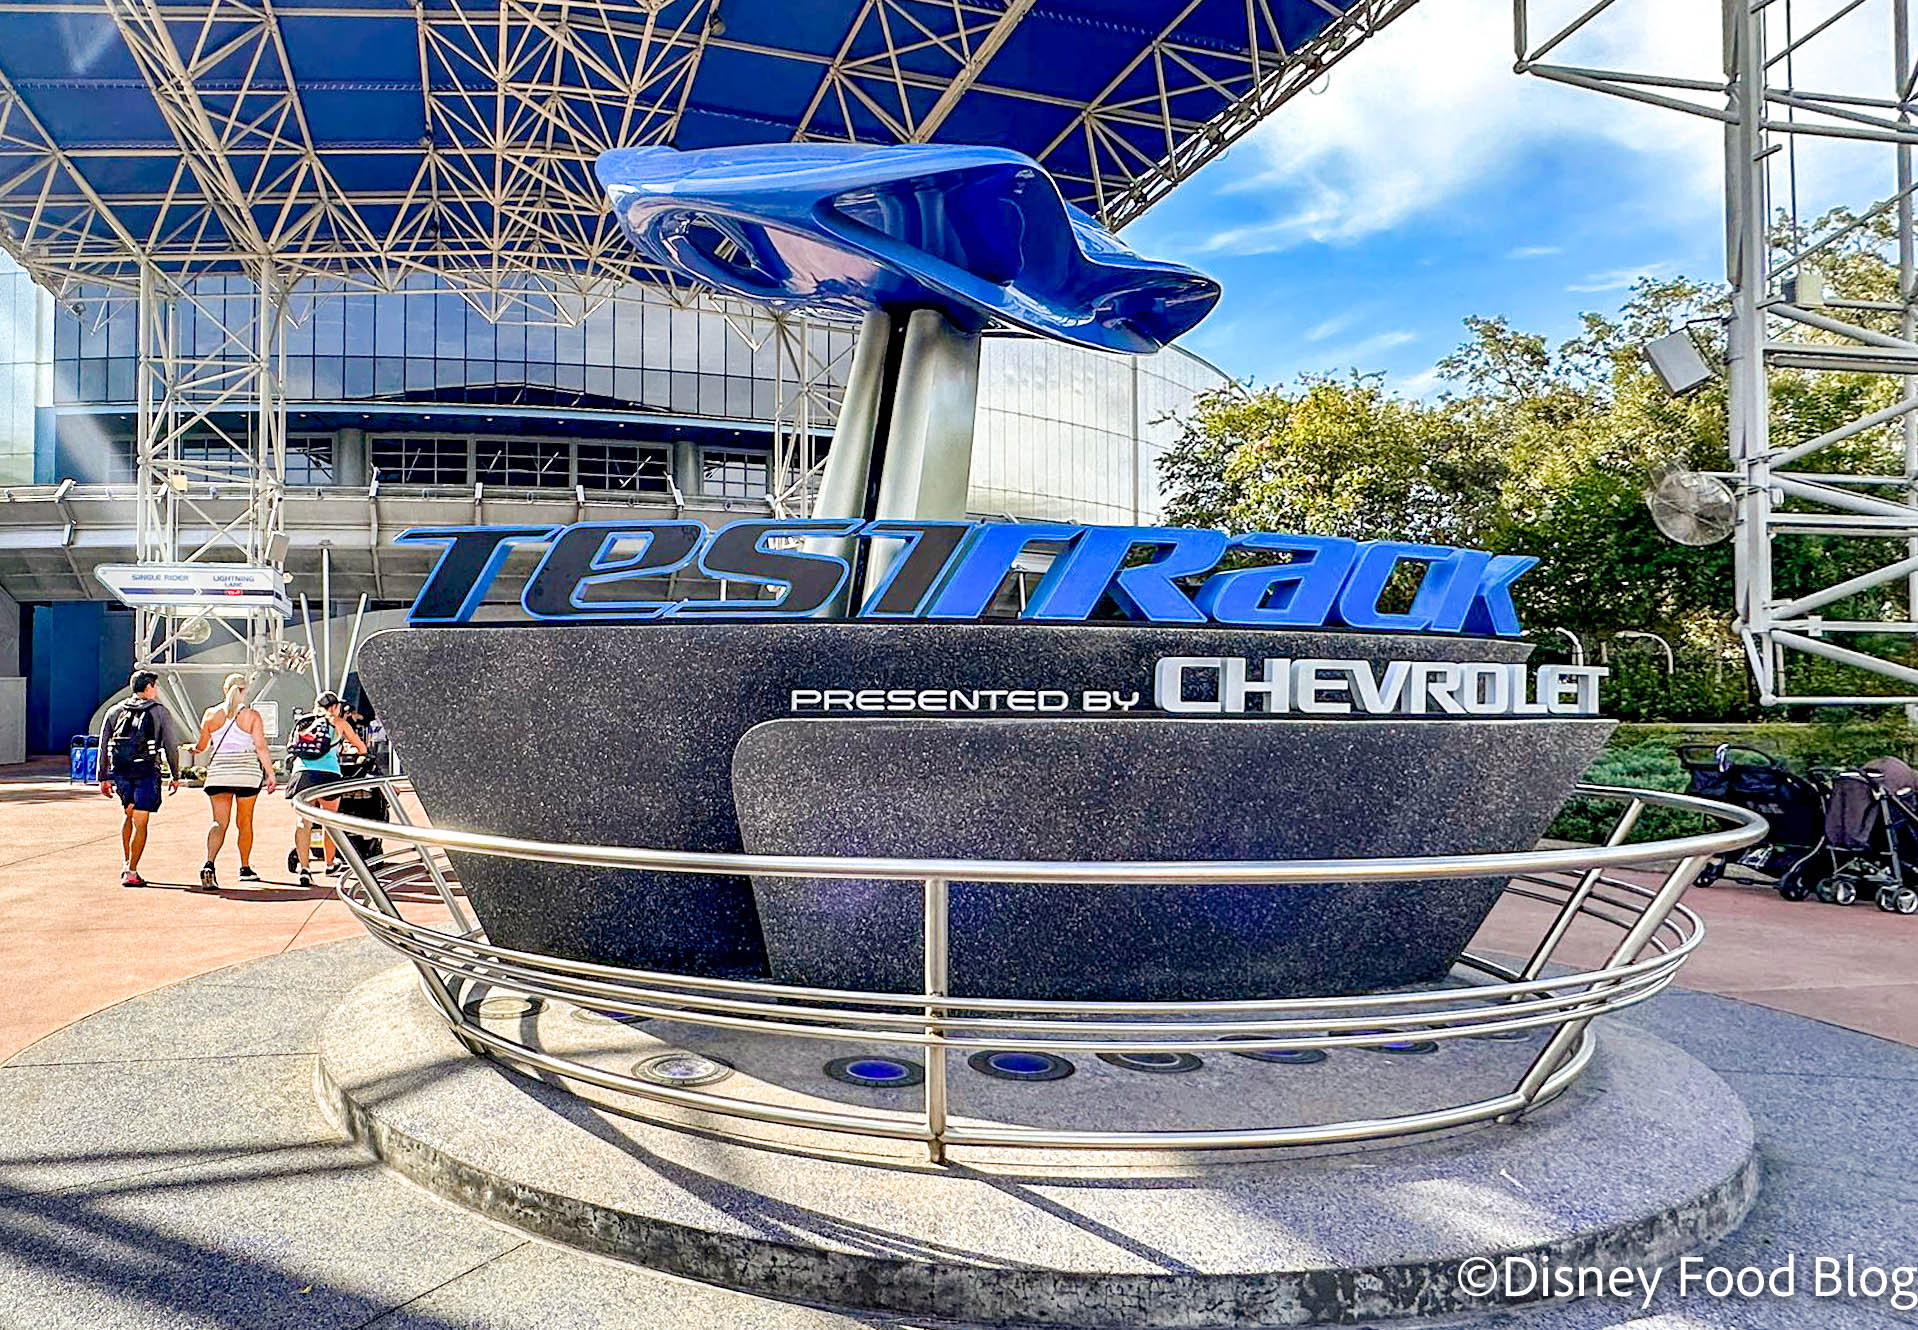
Test Track
Then, Gran Fiesta Tour averaged 8 minutes and Living with the Land at 8 minutes.

Figment
Awesome Planet, Beauty and the Beast Sing-Along, Disney and Pixar Short Film Festival, Impressions de France, and Reflections of China had no wait times this week.
3 Clues About How Test Track Will CHANGE in EPCOT
Hollywood Studios
This week, Slinky Dog Dash saw a big decrease this week from 72 minutes to 63 minutes on average. This is still the longest wait time in the park. Rise of the Resistance is next in this park with 57 minutes which is an increase from last week.
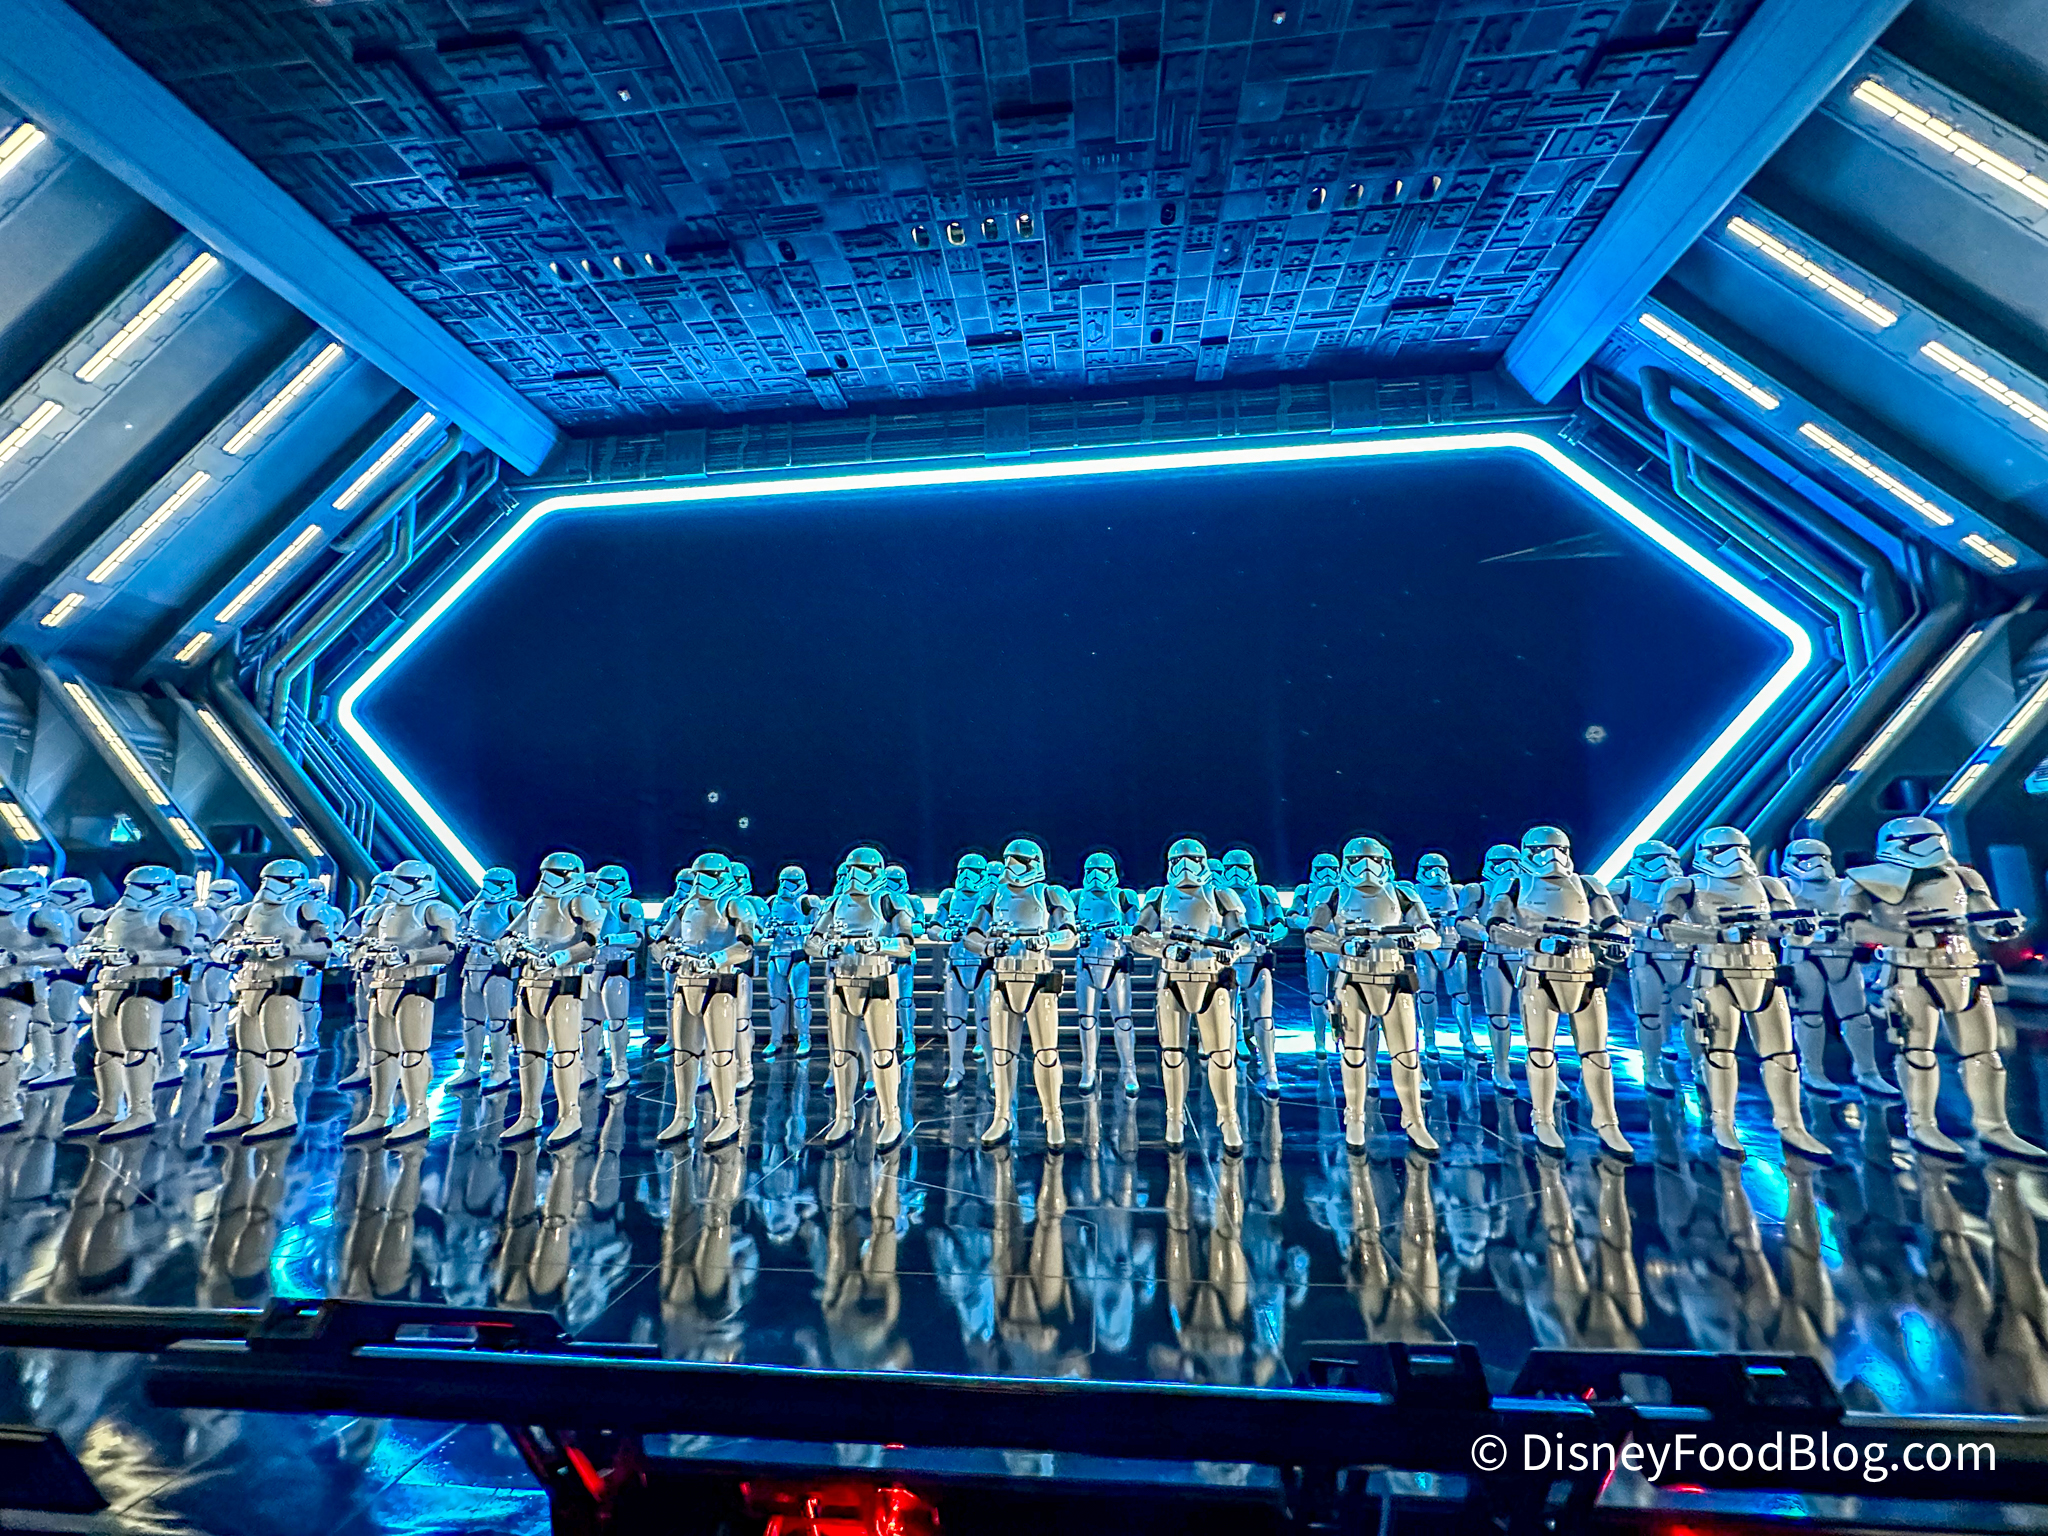
Rise of the Resistance
Other wait times in the park increased this week including Mickey and Minnie’s Runaway Railway and Rock ‘n’ Roller Coaster at 48 minutes, Tower of Terror at 46 minutes, Toy Story Mania at 44 minutes, and Millenium Falcon: Smuggler’s Run at 36 minutes.
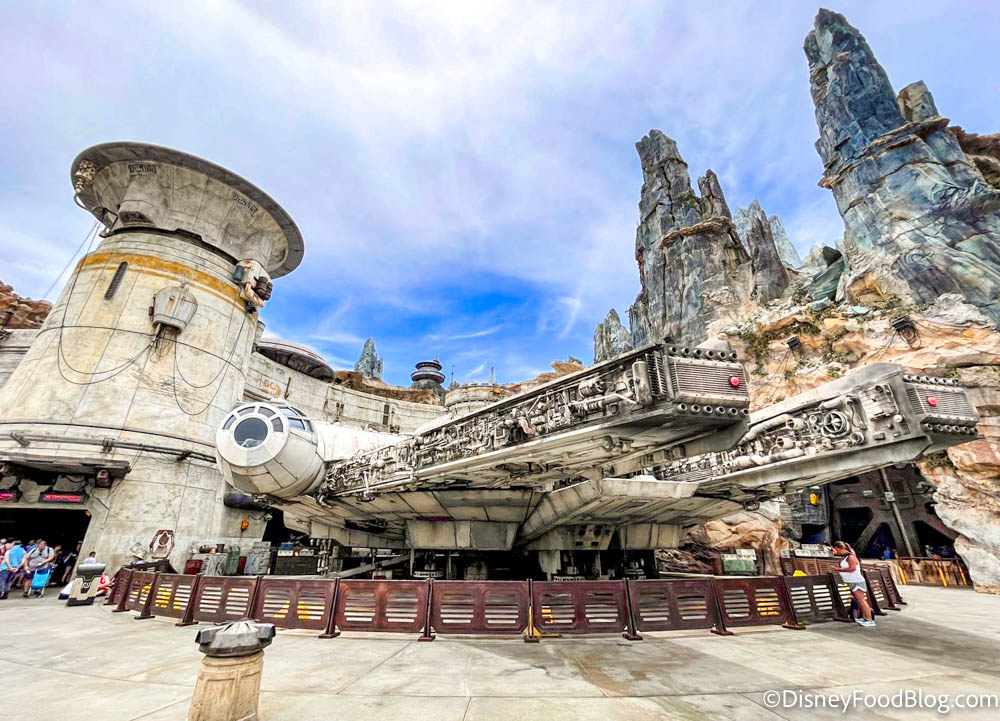
Star Wars: Galaxy’s Edge
After that, Alien Swirling Saucers averaged 19 minutes, Lightning McQueen’s Racing Academy averaged 14 minutes, Walt Disney Presents averaged 13 minutes, Muppet*Vision 3D averaged 10 minutes, and Star Tours — The Adventure Continues averaged only 8 minutes.
The Shocking Things I Learned While Rope Dropping Disney’s Hollywood Studios
Animal Kingdom
Now, let’s head over to Animal Kingdom! Avatar Flight of Passage still had the longest average wait time in all of Disney World this week with 74 minutes. The wait time jumped up from last week’s 58 minutes.
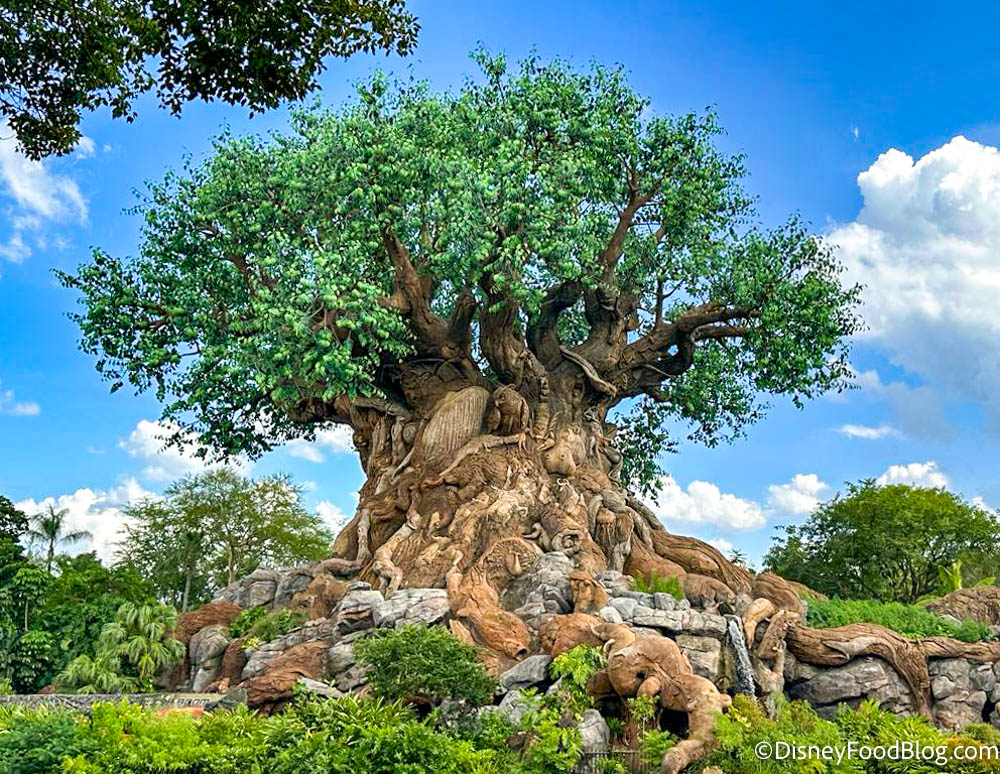
Disney’s Animal Kingdom
Following that, Na’vi River Journey at 61 minutes, Kilimanjaro Safaris at 22 minutes, Expedition Everest at 19 minutes, and Kali River Rapids and DINOSAUR at 18 minutes.
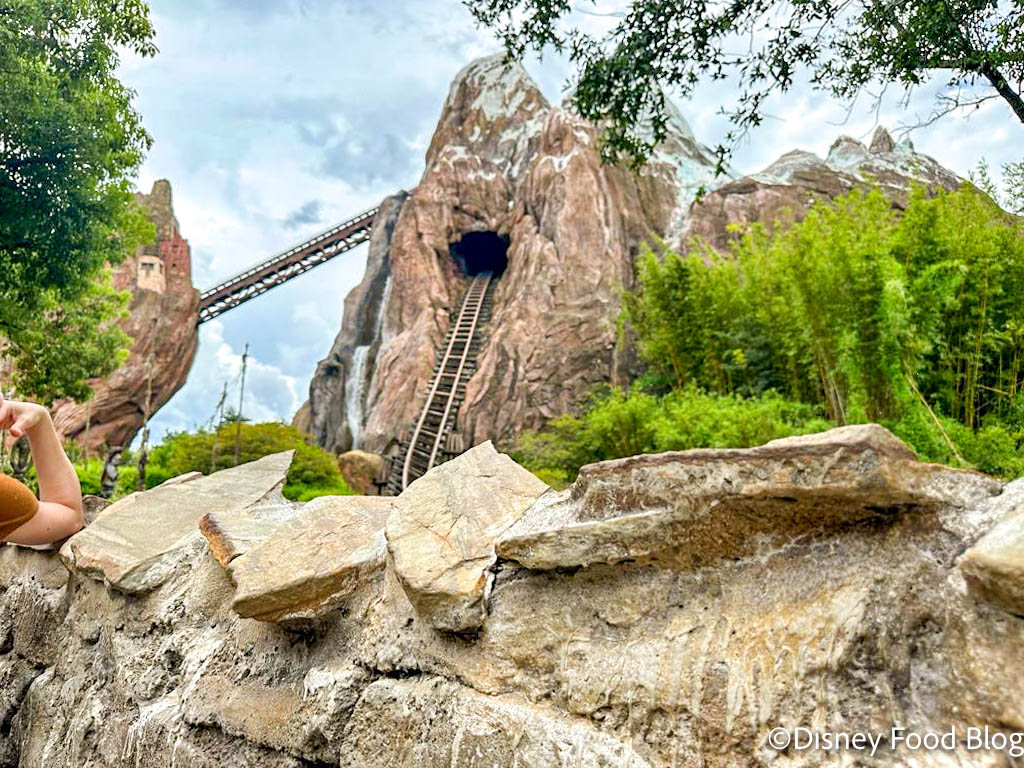
Expedition Everest
It’s Tough to Be a Bug averaged 10 minutes and Triceratop Spin averaged 5 minutes. Both The Boneyard and Gorilla Falls Exploration Trail were walk-ons.
CONFIRMED: Extended Evening Hours Are Coming to Disney’s Animal Kingdom!
Stay tuned to DFB for more updates from Disney World!
3 HUGE EPCOT Announcements Were MISSING from Disney’s Recent News Drop
Join the DFB Newsletter to get all the breaking news right in your inbox! Click here to Subscribe!
WE KNOW DISNEY.
YOU CAN, TOO.
Oh boy, planning a Disney trip can be quite the adventure, and we totally get it! But fear not, dear friends, we compiled EVERYTHING you need (and the things to avoid!) to plan the ULTIMATE Disney vacation.
Whether you’re a rookie or a seasoned pro, our insider tips and tricks will have you exploring the parks like never before. So come along with us, and get planning your most magical vacation ever!
Save 25% on the 2023 DFB Guide to Walt Disney World Dining with code WDW2023.
Have you gone to Magic Kingdom on a day it closes early? What was your experience like? Let us know in the comments below.
The post The Surprising Wait Time Trend Hitting Magic Kingdom first appeared on the disney food blog.