Magic Kingdom Still Looks Busy – Disney World Wait Times for Thursday, December 10, 2020

The Magic Kingdom’s average posted wait times continue to be strong as we head into the weekend.  A few of the park’s headliners, notably Big Thunder Mountain, Space Mountain, and Haunted Mansion, had actual wait times far lower than the posted wait times indicated.  But overall, the park’s average actual wait time was about 70% of the posted wait, which is in line with historical averages.

We’ve received 207 actual wait times so far today – thank you, Liners!  Let’s do the numbers!

Magic Kingdom Wait Times

The Haunted Mansion had an average wait time today of 33 minutes. Its 7-day average is 32 minutes, so today ranks #2 for this week. Its 30-day average is 26 minutes, so today ranks #4 for the past month.  We received 13 actual wait times today, and the actual wait averaged 50% of the posted wait time.

Magic Kingdom wait times for Thursday, December 10, 2020
Astro Orbiter
Average Posted Wait
35
7-Day Rank
#5
30-Day Rank
#18
365-Day Rank
#79
Big Thunder Mountain Railroad
Average Posted Wait
58
Actual Waits Were
58%
7-Day Rank
#1
30-Day Rank
#2
365-Day Rank
#69
Buzz Lightyear’s Space Ranger Spin
Average Posted Wait
38
Actual Waits Were
74%
7-Day Rank
#4
30-Day Rank
#11
365-Day Rank
#105
Dumbo the Flying Elephant
Average Posted Wait
19
7-Day Rank
#1
30-Day Rank
#5
365-Day Rank
#98
“it’s a small world”
Average Posted Wait
44
7-Day Rank
#3
30-Day Rank
#9
365-Day Rank
#46
Jungle Cruise
Average Posted Wait
46
Actual Waits Were
74%
7-Day Rank
#4
30-Day Rank
#12
365-Day Rank
#115
Mad Tea Party
Average Posted Wait
15
7-Day Rank
#5
30-Day Rank
#13
365-Day Rank
#98
Mickey’s PhilharMagic
Average Posted Wait
29
7-Day Rank
#2
30-Day Rank
#2
365-Day Rank
#2
Peter Pan’s Flight
Average Posted Wait
36
Actual Waits Were
78%
7-Day Rank
#4
30-Day Rank
#15
365-Day Rank
#131
Pirates of the Caribbean
Average Posted Wait
49
Actual Waits Were
85%
7-Day Rank
#5
30-Day Rank
#10
365-Day Rank
#88
Space Mountain
Average Posted Wait
40
Actual Waits Were
58%
7-Day Rank
#3
30-Day Rank
#16
365-Day Rank
#142
Splash Mountain
Average Posted Wait
42
Actual Waits Were
68%
7-Day Rank
#3
30-Day Rank
#21
365-Day Rank
#125
The Barnstormer
Average Posted Wait
24
7-Day Rank
#5
30-Day Rank
#17
365-Day Rank
#108
The Haunted Mansion
Average Posted Wait
33
Actual Waits Were
50%
7-Day Rank
#2
30-Day Rank
#4
365-Day Rank
#146
The Magic Carpets of Aladdin
Average Posted Wait
14
7-Day Rank
#2
30-Day Rank
#12
365-Day Rank
#131
The Many Adventures of Winnie the Pooh
Average Posted Wait
26
Actual Waits Were
88%
7-Day Rank
#4
30-Day Rank
#14
365-Day Rank
#128
Tomorrowland Speedway
Average Posted Wait
15
7-Day Rank
#3
30-Day Rank
#20
365-Day Rank
#153
Seven Dwarfs Mine Train
Average Posted Wait
68
Actual Waits Were
75%
7-Day Rank
#3
30-Day Rank
#14
365-Day Rank
#119
Under the Sea ~ Journey of the Little Mermaid
Average Posted Wait
23
Actual Waits Were
62%
7-Day Rank
#5
30-Day Rank
#18
365-Day Rank
#127

Animal Kingdom Wait Times

A couple of interesting tidbits:

  • Expedition Everest had an average wait time today of 18 minutes. We received 10 actual wait times at EE, and the actual wait averaged 38% of the posted wait time.
  • Avatar Flight of Passage had an average wait time today of 56 minutes. We received 4 actual wait times today, and the actual wait averaged 84% of the posted wait time.
Animal Kingdom wait times for Thursday, December 10, 2020
DINOSAUR
Average Posted Wait
33
Actual Waits Were
82%
7-Day Rank
#4
30-Day Rank
#18
365-Day Rank
#121
Expedition Everest – Legend of the Forbidden Mountain
Average Posted Wait
18
Actual Waits Were
38%
7-Day Rank
#5
30-Day Rank
#27
365-Day Rank
#196
Kali River Rapids
Average Posted Wait
10
7-Day Rank
#4
30-Day Rank
#27
365-Day Rank
#142
Kilimanjaro Safaris
Average Posted Wait
28
Actual Waits Were
68%
7-Day Rank
#1
30-Day Rank
#9
365-Day Rank
#112
It’s Tough to Be a Bug!
Average Posted Wait
18
7-Day Rank
#4
30-Day Rank
#16
365-Day Rank
#41
TriceraTop Spin
Average Posted Wait
5
7-Day Rank
#4
30-Day Rank
#22
365-Day Rank
#118
Na’vi River Journey
Average Posted Wait
51
Actual Waits Were
84%
7-Day Rank
#3
30-Day Rank
#15
365-Day Rank
#117
Avatar Flight of Passage
Average Posted Wait
56
Actual Waits Were
84%
7-Day Rank
#3
30-Day Rank
#15
365-Day Rank
#139

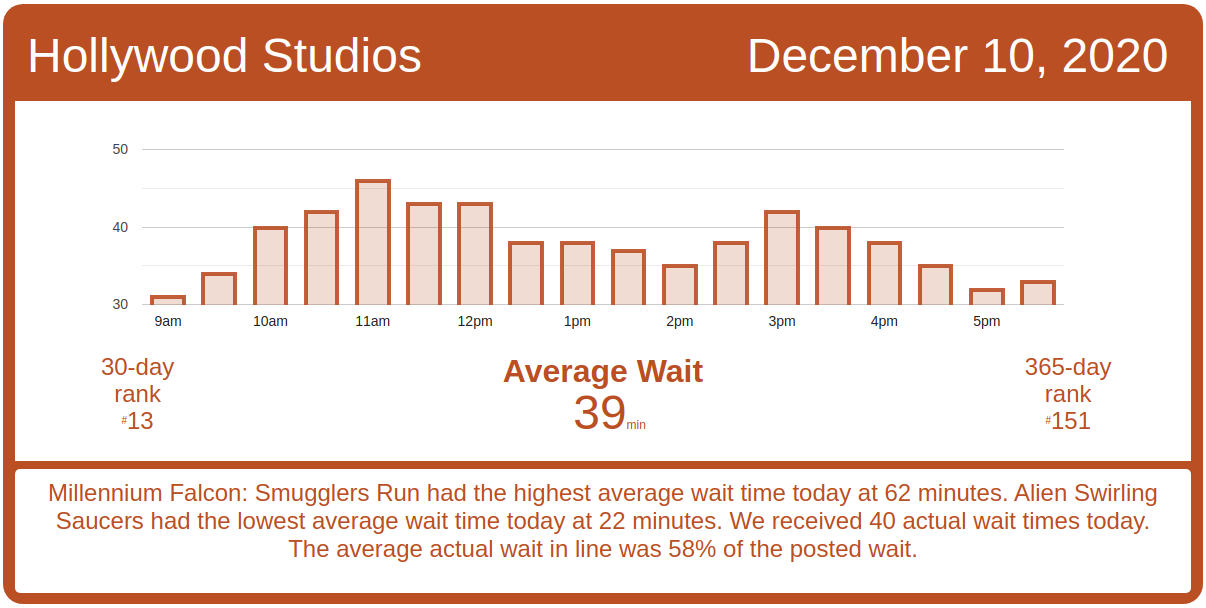
Hollywood Studios Wait Times

Wait times at the Studios were also overstated today more than usual.  No major ride’s actual wait time averaged more than 61% of the posted wait when we measured them.  That’s low by the park’s historical averages.

Star Tours: The Adventures Continue had an average wait time today of 25 minutes. Its 7-day average is 30 minutes, so today ranks #6 for this week. Its 30-day average is 26 minutes, so today ranks #16 for the past month. Its 365-day average is 27 minutes, so today ranks #128 for the past year. We received 4 actual wait times today, and the actual wait averaged 37% of the posted wait time.

Hollywood Studios wait times for Thursday, December 10, 2020

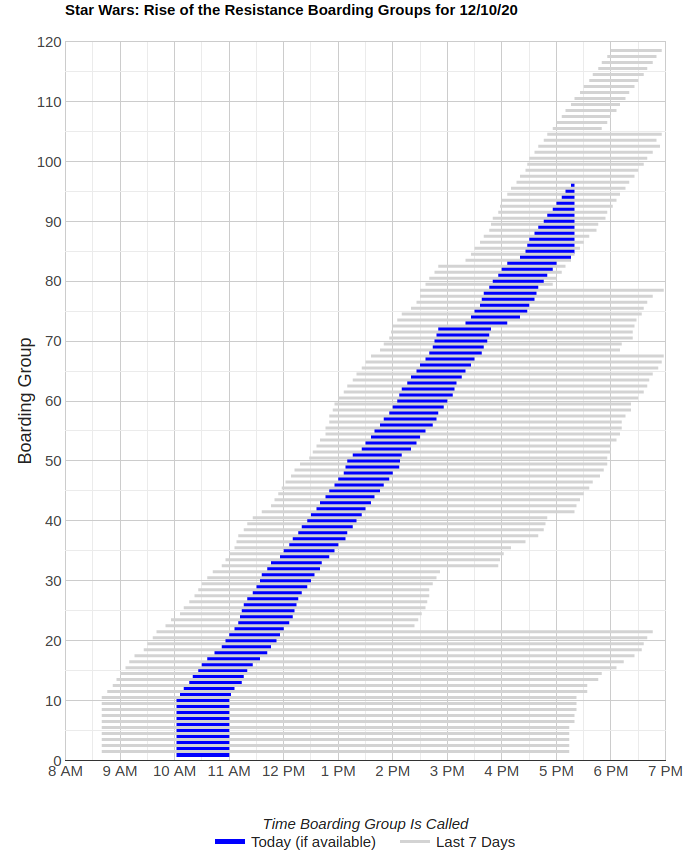
Rise of the Resistance had a really solid day of operations today, with steady calling of boarding groups from the moment the park opened.  There’s been one small delay in calling boarding groups, from just before 3 p.m. for about 30 minutes.  That happens almost every day, though, so it’s almost certainly a scheduled break.

Rise of the Resistance boarding groups for Thursday, December 10, 2020
Muppet*Vision 3D
Average Posted Wait
30
7-Day Rank
#2
30-Day Rank
#2
365-Day Rank
#2
Rock ‘n’ Roller Coaster Starring Aerosmith
Average Posted Wait
37
Actual Waits Were
52%
7-Day Rank
#6
30-Day Rank
#28
365-Day Rank
#185
Star Tours: The Adventures Continue
Average Posted Wait
25
Actual Waits Were
37%
7-Day Rank
#6
30-Day Rank
#16
365-Day Rank
#128
The Twilight Zone Tower of Terror
Average Posted Wait
52
7-Day Rank
#4
30-Day Rank
#9
365-Day Rank
#108
Toy Story Mania!
Average Posted Wait
27
Actual Waits Were
52%
7-Day Rank
#2
30-Day Rank
#12
365-Day Rank
#149
Slinky Dog Dash
Average Posted Wait
52
Actual Waits Were
61%
7-Day Rank
#6
30-Day Rank
#29
365-Day Rank
#181
Alien Swirling Saucers
Average Posted Wait
22
7-Day Rank
#6
30-Day Rank
#26
365-Day Rank
#173
Mickey & Minnie’s Runaway Railway
Average Posted Wait
54
Actual Waits Were
53%
7-Day Rank
#2
30-Day Rank
#9
365-Day Rank
#111
Millennium Falcon: Smugglers Run
Average Posted Wait
62
7-Day Rank
#2
30-Day Rank
#3
365-Day Rank
#106

EPCOT Wait Times

And over at EPCOT, the only attraction whose actual wait times were more than 61% of the posted wait was Frozen Ever After. FEA had an average wait time today of 76 minutes. Its 7-day average is 80 minutes, so today ranks #3 for this week. Its 30-day average is 74 minutes, so today ranks #13 for the past month. We received 5 actual wait times today, and the actual wait averaged 71% of the posted wait time.

EPCOT wait times for Thursday, December 10, 2020
Gran Fiesta Tour Starring The Three Caballeros
Average Posted Wait
15
7-Day Rank
#1
30-Day Rank
#2
365-Day Rank
#38
Journey Into Imagination With Figment
Average Posted Wait
18
Actual Waits Were
48%
7-Day Rank
#2
30-Day Rank
#13
365-Day Rank
#90
Living with the Land
Average Posted Wait
13
Actual Waits Were
23%
7-Day Rank
#2
30-Day Rank
#9
365-Day Rank
#112
Mission: SPACE Orange
Average Posted Wait
28
7-Day Rank
#2
30-Day Rank
#13
365-Day Rank
#95
Soarin’
Average Posted Wait
43
Actual Waits Were
65%
7-Day Rank
#3
30-Day Rank
#15
365-Day Rank
#91
Spaceship Earth
Average Posted Wait
24
Actual Waits Were
60%
7-Day Rank
#3
30-Day Rank
#12
365-Day Rank
#88
Test Track
Average Posted Wait
64
Actual Waits Were
61%
7-Day Rank
#3
30-Day Rank
#14
365-Day Rank
#72
The Seas with Nemo & Friends
Average Posted Wait
10
7-Day Rank
#4
30-Day Rank
#17
365-Day Rank
#154
Frozen Ever After
Average Posted Wait
76
Actual Waits Were
71%
7-Day Rank
#3
30-Day Rank
#13
365-Day Rank
#48

The post Magic Kingdom Still Looks Busy – Disney World Wait Times for Thursday, December 10, 2020 appeared first on TouringPlans.com Blog.