Seriously, EPCOT? Disney World Wait Times for Tuesday, December 15, 2020

EPCOT’s attractions’ posted wait times have been overinflated for a couple of days now, and you have to wonder if it’s Disney’s way of telling guests to go somewhere other than a ride, without saying “Please go somewhere that’s not a ride.”  More on that below.  And in related news, we got 131 actual wait times today from some fabulous Lines app users – thanks to all of you!  We counted 486 of 500 (97%) guests at EPCOT today wearing masks completely in line with Disney’s policies.  Let’s do the numbers!

Magic Kingdom Wait Times

More than a few Magic Kingdom headliners had strong wait times today. Space Mountain had an average wait time today of 49 minutes. Its 7-day average is 44 minutes, so today ranks #1 for this week. Its 30-day average is 44 minutes, so today ranks #9 for the past month. And Splash Mountain had an average wait time today of 57 minutes. Its 7-day average is 44 minutes, so today ranks #1 for this week. Its 30-day average is 51 minutes, so today ranks #10 for the past month. We received 5 actual wait times today, and the actual wait averaged 67% of the posted wait time.

Magic Kingdom wait times for Tuesday, December 15, 2020
Astro Orbiter
Average Posted Wait
43
7-Day Rank
#1
30-Day Rank
#2
365-Day Rank
#16
Big Thunder Mountain Railroad
Average Posted Wait
55
7-Day Rank
#3
30-Day Rank
#5
365-Day Rank
#81
Buzz Lightyear’s Space Ranger Spin
Average Posted Wait
44
7-Day Rank
#1
30-Day Rank
#1
365-Day Rank
#71
Prince Charming Regal Carrousel
Average Posted Wait
38
7-Day Rank
#1
30-Day Rank
#1
365-Day Rank
#1
Dumbo the Flying Elephant
Average Posted Wait
15
Actual Waits Were
138%
7-Day Rank
#4
30-Day Rank
#18
365-Day Rank
#119
“it’s a small world”
Average Posted Wait
49
Actual Waits Were
99%
7-Day Rank
#1
30-Day Rank
#1
365-Day Rank
#14
Jungle Cruise
Average Posted Wait
44
7-Day Rank
#5
30-Day Rank
#19
365-Day Rank
#126
Mad Tea Party
Average Posted Wait
15
7-Day Rank
#4
30-Day Rank
#14
365-Day Rank
#99
Mickey’s PhilharMagic
Average Posted Wait
34
7-Day Rank
#1
30-Day Rank
#1
365-Day Rank
#1
Peter Pan’s Flight
Average Posted Wait
46
Actual Waits Were
63%
7-Day Rank
#1
30-Day Rank
#1
365-Day Rank
#92
Pirates of the Caribbean
Average Posted Wait
58
Actual Waits Were
84%
7-Day Rank
#1
30-Day Rank
#1
365-Day Rank
#24
Space Mountain
Average Posted Wait
49
7-Day Rank
#1
30-Day Rank
#9
365-Day Rank
#113
Splash Mountain
Average Posted Wait
57
Actual Waits Were
67%
7-Day Rank
#1
30-Day Rank
#10
365-Day Rank
#68
The Barnstormer
Average Posted Wait
28
7-Day Rank
#2
30-Day Rank
#9
365-Day Rank
#83
The Haunted Mansion
Average Posted Wait
33
7-Day Rank
#1
30-Day Rank
#4
365-Day Rank
#141
The Magic Carpets of Aladdin
Average Posted Wait
13
7-Day Rank
#5
30-Day Rank
#19
365-Day Rank
#149
The Many Adventures of Winnie the Pooh
Average Posted Wait
29
7-Day Rank
#3
30-Day Rank
#9
365-Day Rank
#110
Tomorrowland Speedway
Average Posted Wait
17
Actual Waits Were
57%
7-Day Rank
#3
30-Day Rank
#16
365-Day Rank
#133
Seven Dwarfs Mine Train
Average Posted Wait
72
Actual Waits Were
79%
7-Day Rank
#1
30-Day Rank
#9
365-Day Rank
#106
Under the Sea ~ Journey of the Little Mermaid
Average Posted Wait
27
7-Day Rank
#2
30-Day Rank
#7
365-Day Rank
#93

Animal Kingdom Wait Times

Kilimanjaro Safaris had an average wait time today of 16 minutes. Its 7-day average is 31 minutes, so today ranks #6 for this week. Its 30-day average is 25 minutes, so today ranks #24 for the past month. Its 365-day average is 44 minutes, so today ranks #178 for the past year. We received 6 actual wait times today, and the actual wait averaged 47% of the posted wait time.

Animal Kingdom wait times for Tuesday, December 15, 2020
DINOSAUR
Average Posted Wait
43
7-Day Rank
#2
30-Day Rank
#10
365-Day Rank
#84
Expedition Everest – Legend of the Forbidden Mountain
Average Posted Wait
19
Actual Waits Were
50%
7-Day Rank
#5
30-Day Rank
#26
365-Day Rank
#189
Kali River Rapids
Average Posted Wait
14
7-Day Rank
#3
30-Day Rank
#17
365-Day Rank
#97
Kilimanjaro Safaris
Average Posted Wait
16
Actual Waits Were
47%
7-Day Rank
#6
30-Day Rank
#24
365-Day Rank
#178
It’s Tough to Be a Bug!
Average Posted Wait
20
7-Day Rank
#4
30-Day Rank
#15
365-Day Rank
#33
TriceraTop Spin
Average Posted Wait
5
7-Day Rank
#2
30-Day Rank
#21
365-Day Rank
#116
Na’vi River Journey
Average Posted Wait
54
Actual Waits Were
70%
7-Day Rank
#3
30-Day Rank
#11
365-Day Rank
#111
Avatar Flight of Passage
Average Posted Wait
52
Actual Waits Were
80%
7-Day Rank
#6
30-Day Rank
#21
365-Day Rank
#146

Hollywood Studios Wait Times

Millennium Falcon: Smugglers Run had an average wait time today of 67 minutes. Its 7-day average is 55 minutes, so today ranks #1 for this week. Its 30-day average is 53 minutes, so today ranks #1 for the past month. I’m a little suspicious of this average, because Rock ‘n’ Roller Coaster and Toy Story Mania had actual wait times that averaged less than 60% of the posted wait.

Hollywood Studios wait times for Tuesday, December 15, 2020

Rise of the Resistance had a rough afternoon.  There’s normally a break of around 30 minutes at 3 p.m., presumably for maintenance or cleaning.  Today that break lasted about an hour and 45 minutes, until around 4:30 p.m.  Rise was running smoothly before that, so hopefully things will be back to normal for the rest of the day.

Rise of the Resistance boarding groups for Tuesday, December 15, 2020
Muppet*Vision 3D
Average Posted Wait
32
7-Day Rank
#1
30-Day Rank
#1
365-Day Rank
#1
Rock ‘n’ Roller Coaster Starring Aerosmith
Average Posted Wait
35
Actual Waits Were
57%
7-Day Rank
#3
30-Day Rank
#25
365-Day Rank
#191
Star Tours: The Adventures Continue
Average Posted Wait
33
7-Day Rank
#1
30-Day Rank
#2
365-Day Rank
#56
The Twilight Zone Tower of Terror
Average Posted Wait
65
7-Day Rank
#1
30-Day Rank
#2
365-Day Rank
#69
Toy Story Mania!
Average Posted Wait
25
Actual Waits Were
56%
7-Day Rank
#4
30-Day Rank
#23
365-Day Rank
#166
Slinky Dog Dash
Average Posted Wait
53
Actual Waits Were
68%
7-Day Rank
#3
30-Day Rank
#26
365-Day Rank
#176
Alien Swirling Saucers
Average Posted Wait
26
7-Day Rank
#2
30-Day Rank
#13
365-Day Rank
#132
Mickey & Minnie’s Runaway Railway
Average Posted Wait
50
7-Day Rank
#2
30-Day Rank
#12
365-Day Rank
#130
Millennium Falcon: Smugglers Run
Average Posted Wait
67
7-Day Rank
#1
30-Day Rank
#1
365-Day Rank
#66

EPCOT Wait Times

EPCOT wait times for Tuesday, December 15, 2020

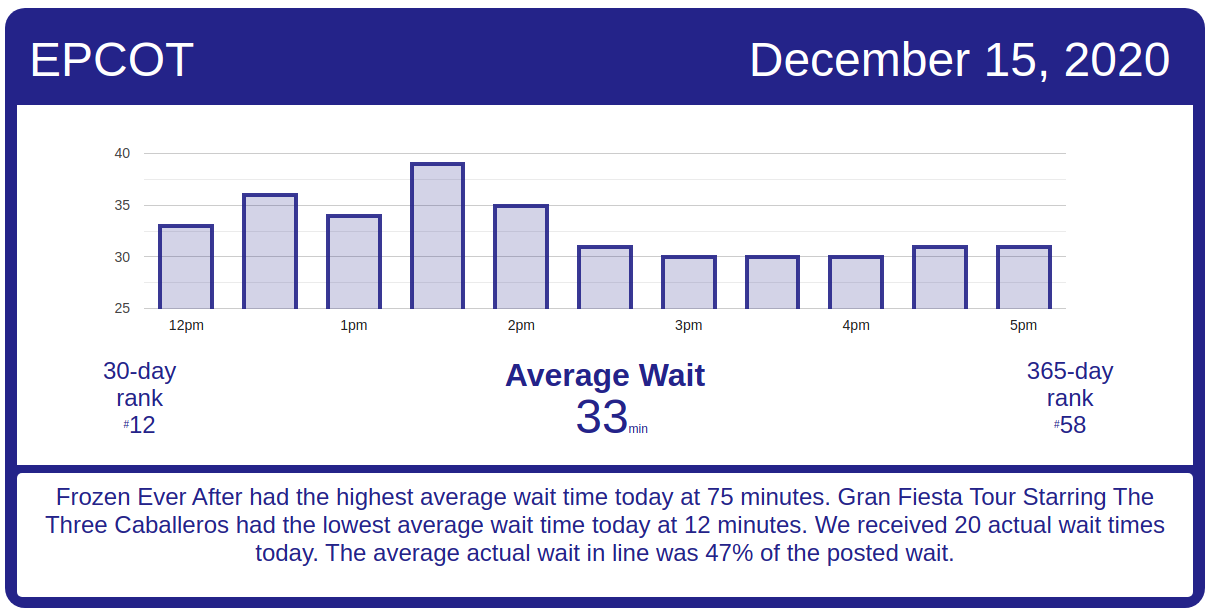
On to EPCOT.  EPCOT’s posted wait times seem to be significantly overstating how long you’ll actually wait in line at some rides.  We’d normally expect to see actual wait times run about 80% of the posted wait – so if Soarin’s posted wait time is 60 minutes, you’d actually wait in line around 48.  What we’re seeing lately, however, is that actual waits are around half of the posted wait.  A set of recent examples is below.

The problem with inaccurate posted wait times is that they prevent guests from making their own decisions about how to best use their time in the parks.  When guests don’t get in a line because it’s too long, they’re said to balk.  Every person has their own balking time for each ride – for example, I’ll wait an hour for Splash Mountain, but I’ll only wait 10 minutes for Mad Tea Party, before I decide to go somewhere else.

In EPCOT, for example, there are plenty of people who’d get in line for Test Track if they knew the actual wait time was going to be 30 minutes or less.  But when they see posted wait times of 70 minutes, as they did yesterday, some of them will decide to go somewhere else.  They made a different decision than they would have, because they didn’t have accurate information.

Here’s yesterday’s times from Test Track – the black dots are posted wait times, and the green dots are actual wait times.  From noon to 12:30 p.m., Test Track’s posted wait time was 70 minutes, while the actual waits in line we got were 23, 29, and 32 minutes.  Later in the day, posted wait times of between 45 and 50 minutes yielded actual wait times of 25 and 27 minutes.

Test Track posted and actual wait times from Monday, December 14, 2020

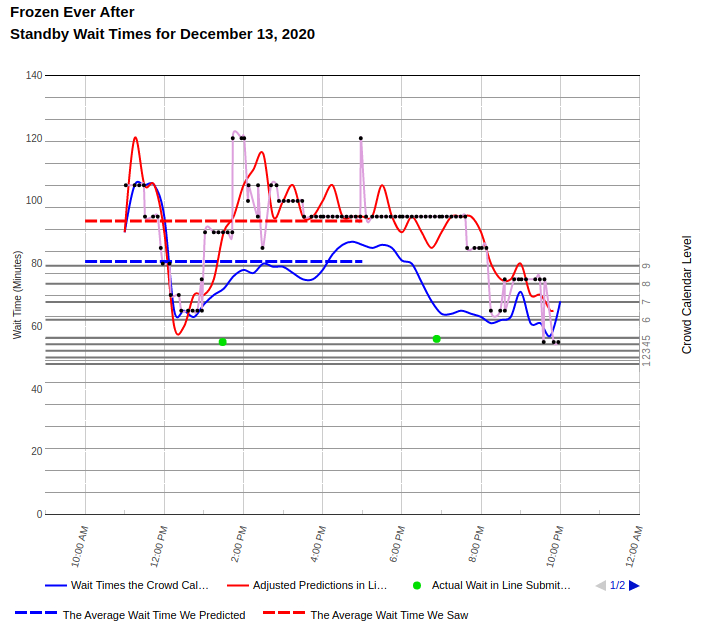
Here are two example from Frozen Ever After from Sunday – a posted wait time of 90 minutes around 1:30 p.m. resulted in an actual wait of 55 minutes; and a posted wait time of 95 minutes at 7 p.m. resulted in an actual wait of 56 minutes.

Frozen Ever After posted and actual wait times for Sunday, December 13, 2020

And here are fourteen examples from Soarin’ on Friday, December 11.  Soarin’s posted wait time was 65 minutes between 11:30 a.m. and 12:45 p.m., while actual wait times we collected were 23, 29, 34, and 35 minutes.  Posted wait times of 50 minutes were really 25 minute actual waits just before 2 p.m., and posted waits of 35 minutes were 16 minutes later in the afternoon.

Soarin’ posted and actual wait times from Friday, December 11, 2020
Gran Fiesta Tour Starring The Three Caballeros
Average Posted Wait
12
7-Day Rank
#1
30-Day Rank
#4
365-Day Rank
#68
Journey Into Imagination With Figment
Average Posted Wait
23
7-Day Rank
#2
30-Day Rank
#10
365-Day Rank
#51
Living with the Land
Average Posted Wait
13
Actual Waits Were
24%
7-Day Rank
#4
30-Day Rank
#13
365-Day Rank
#120
Mission: SPACE Orange
Average Posted Wait
31
7-Day Rank
#3
30-Day Rank
#13
365-Day Rank
#82
Soarin’
Average Posted Wait
48
Actual Waits Were
54%
7-Day Rank
#2
30-Day Rank
#12
365-Day Rank
#66
Spaceship Earth
Average Posted Wait
23
Actual Waits Were
46%
7-Day Rank
#4
30-Day Rank
#14
365-Day Rank
#107
Test Track
Average Posted Wait
70
7-Day Rank
#2
30-Day Rank
#11
365-Day Rank
#49
The Seas with Nemo & Friends
Average Posted Wait
15
7-Day Rank
#1
30-Day Rank
#6
365-Day Rank
#99
Frozen Ever After
Average Posted Wait
75
7-Day Rank
#5
30-Day Rank
#16
365-Day Rank
#56

The post Seriously, EPCOT? Disney World Wait Times for Tuesday, December 15, 2020 appeared first on TouringPlans.com Blog.