Holiday Crowds! – Disney World Wait Times for Monday, December 21, 2020

The average posted wait at Seven Dwarfs Mine Train today was just under 100 minutes, so it’s safe to say holiday crowds have arrived at Walt Disney World. Having said that, the actual wait times at the park were just 64% of the posted wait, so things weren’t as desperate as the posted waits might’ve indicated.  We counted 493 of 500 guests (99%) in the Magic Kingdom wearing masks according to Disney’s guidelines. And we got 210 actual wait times today from our fabulous Lines users! Let’s do the numbers!

Magic Kingdom Wait Times

Big Thunder Mountain Railroad had an average wait time today of 68 minutes. Its 7-day average is 53 minutes, so today ranks #1 for this week. Its 30-day average is 52 minutes, so today ranks #1 for the past month. We received 8 actual wait times today, and the actual wait averaged 53% of the posted wait time.

Magic Kingdom wait times for Monday, December 21, 2020
Astro Orbiter
Average Posted Wait
49
7-Day Rank
#1
30-Day Rank
#1
365-Day Rank
#4
Big Thunder Mountain Railroad
Average Posted Wait
68
Actual Waits Were
53%
7-Day Rank
#1
30-Day Rank
#1
365-Day Rank
#46
Buzz Lightyear’s Space Ranger Spin
Average Posted Wait
50
Actual Waits Were
72%
7-Day Rank
#1
30-Day Rank
#1
365-Day Rank
#53
Prince Charming Regal Carrousel
Average Posted Wait
40
7-Day Rank
#1
30-Day Rank
#1
365-Day Rank
#1
Dumbo the Flying Elephant
Average Posted Wait
28
Actual Waits Were
70%
7-Day Rank
#1
30-Day Rank
#1
365-Day Rank
#64
“it’s a small world”
Average Posted Wait
57
Actual Waits Were
83%
7-Day Rank
#1
30-Day Rank
#1
365-Day Rank
#3
Jungle Cruise
Average Posted Wait
56
Actual Waits Were
68%
7-Day Rank
#1
30-Day Rank
#1
365-Day Rank
#78
Mad Tea Party
Average Posted Wait
28
7-Day Rank
#1
30-Day Rank
#1
365-Day Rank
#21
Mickey’s PhilharMagic
Average Posted Wait
35
7-Day Rank
#1
30-Day Rank
#1
365-Day Rank
#1
Peter Pan’s Flight
Average Posted Wait
55
Actual Waits Were
72%
7-Day Rank
#1
30-Day Rank
#1
365-Day Rank
#83
Pirates of the Caribbean
Average Posted Wait
69
Actual Waits Were
54%
7-Day Rank
#1
30-Day Rank
#1
365-Day Rank
#3
Space Mountain
Average Posted Wait
82
Actual Waits Were
67%
7-Day Rank
#1
30-Day Rank
#1
365-Day Rank
#58
Splash Mountain
Average Posted Wait
65
Actual Waits Were
65%
7-Day Rank
#1
30-Day Rank
#7
365-Day Rank
#48
The Barnstormer
Average Posted Wait
40
7-Day Rank
#1
30-Day Rank
#1
365-Day Rank
#37
The Haunted Mansion
Average Posted Wait
41
Actual Waits Were
55%
7-Day Rank
#1
30-Day Rank
#1
365-Day Rank
#117
The Magic Carpets of Aladdin
Average Posted Wait
23
7-Day Rank
#1
30-Day Rank
#1
365-Day Rank
#81
The Many Adventures of Winnie the Pooh
Average Posted Wait
38
Actual Waits Were
56%
7-Day Rank
#1
30-Day Rank
#1
365-Day Rank
#71
Tomorrowland Speedway
Average Posted Wait
37
Actual Waits Were
51%
7-Day Rank
#1
30-Day Rank
#1
365-Day Rank
#38
Seven Dwarfs Mine Train
Average Posted Wait
99
7-Day Rank
#1
30-Day Rank
#1
365-Day Rank
#83
Under the Sea ~ Journey of the Little Mermaid
Average Posted Wait
36
Actual Waits Were
38%
7-Day Rank
#1
30-Day Rank
#1
365-Day Rank
#38

Animal Kingdom Wait Times

Avatar Flight of Passage had an average wait time today of 91 minutes. Its 7-day average is 62 minutes, so today ranks #1 for this week. Its 30-day average is 71 minutes, so today ranks #4 for the past month. We received 8 actual wait times today, and the actual wait averaged 79% of the posted wait time, which is reasonably accurate for that ride.

Not so at Kilimanjaro Safaris – Safaris had an average wait time today of 33 minutes. Its 7-day average is 19 minutes, so today ranks #1 for this week. Its 30-day average is 25 minutes, so today ranks #6 for the past month.  We received 11 actual wait times today, and the actual wait averaged 48% of the posted wait time.

Animal Kingdom wait times for Monday, December 21, 2020
DINOSAUR
Average Posted Wait
63
Actual Waits Were
95%
7-Day Rank
#1
30-Day Rank
#3
365-Day Rank
#22
Expedition Everest – Legend of the Forbidden Mountain
Average Posted Wait
43
Actual Waits Were
52%
7-Day Rank
#1
30-Day Rank
#9
365-Day Rank
#99
Kali River Rapids
Average Posted Wait
17
7-Day Rank
#1
30-Day Rank
#11
365-Day Rank
#69
Kilimanjaro Safaris
Average Posted Wait
33
Actual Waits Were
48%
7-Day Rank
#1
30-Day Rank
#6
365-Day Rank
#95
It’s Tough to Be a Bug!
Average Posted Wait
32
7-Day Rank
#1
30-Day Rank
#1
365-Day Rank
#1
TriceraTop Spin
Average Posted Wait
9
7-Day Rank
#1
30-Day Rank
#5
365-Day Rank
#61
Na’vi River Journey
Average Posted Wait
71
7-Day Rank
#1
30-Day Rank
#2
365-Day Rank
#76
Avatar Flight of Passage
Average Posted Wait
91
Actual Waits Were
79%
7-Day Rank
#1
30-Day Rank
#4
365-Day Rank
#90

Hollywood Studios Wait Times

Millennium Falcon: Smugglers Run had an average wait time today of 78 minutes. Its 7-day average is 73 minutes, so today ranks #1 for this week. Its 30-day average is 57 minutes, so today ranks #1 for the past month. Its 365-day average is 61 minutes, so today ranks #45 for the past year. We received 5 actual wait times today, and the actual wait averaged 104% of the posted wait time.

Hollywood Studios wait times for Monday, December 21, 2020

Staying in Galaxy’s Edge, Rise of the Resistance had a solid day of operations. Boarding groups began experiencing the ride around 8:45 a.m.  There have been only two minor delays in calling boarding groups – one from around 11 a.m. to 11:30 a.m., and the usual break around 3 p.m.  It looks like Rise will call more than 150 boarding groups today.
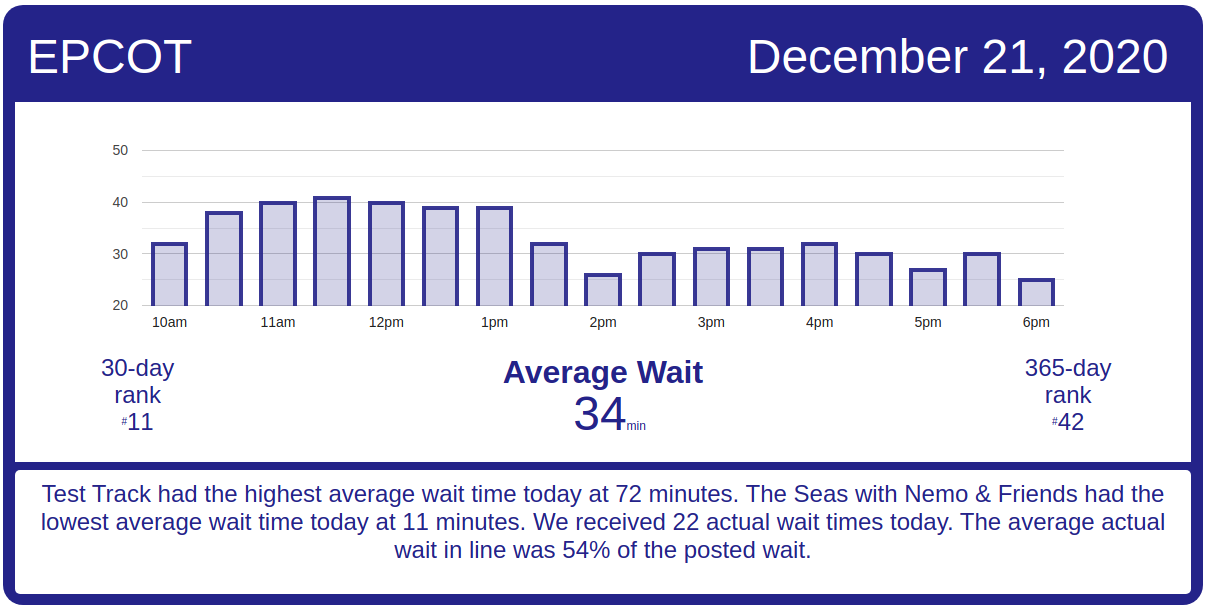
Rise of the Resistance boarding groups for Monday, December 21, 2020
Muppet*Vision 3D
Average Posted Wait
33
7-Day Rank
#1
30-Day Rank
#1
365-Day Rank
#1
Rock ‘n’ Roller Coaster Starring Aerosmith
Average Posted Wait
54
Actual Waits Were
91%
7-Day Rank
#1
30-Day Rank
#6
365-Day Rank
#109
Star Tours: The Adventures Continue
Average Posted Wait
42
Actual Waits Were
46%
7-Day Rank
#1
30-Day Rank
#1
365-Day Rank
#25
The Twilight Zone Tower of Terror
Average Posted Wait
65
Actual Waits Were
93%
7-Day Rank
#3
30-Day Rank
#5
365-Day Rank
#69
Toy Story Mania!
Average Posted Wait
35
Actual Waits Were
60%
7-Day Rank
#1
30-Day Rank
#1
365-Day Rank
#90
Rock ‘n’ Roller Coaster Single Rider Line
Average Posted Wait
50
7-Day Rank
#1
30-Day Rank
#1
365-Day Rank
#1
Slinky Dog Dash
Average Posted Wait
69
Actual Waits Were
68%
7-Day Rank
#1
30-Day Rank
#15
365-Day Rank
#122
Alien Swirling Saucers
Average Posted Wait
33
7-Day Rank
#2
30-Day Rank
#3
365-Day Rank
#72
Mickey & Minnie’s Runaway Railway
Average Posted Wait
51
Actual Waits Were
63%
7-Day Rank
#2
30-Day Rank
#11
365-Day Rank
#130
Millennium Falcon: Smugglers Run
Average Posted Wait
78
Actual Waits Were
104%
7-Day Rank
#1
30-Day Rank
#1
365-Day Rank
#45

EPCOT Wait Times

Wait times at EPCOT continue to be inflated relative to your actual wait. Test Track had an average wait time today of 72 minutes. We received 5 actual wait times today, and the actual wait averaged 45% of the posted wait time.

EPCOT wait times for Monday, December 21, 2020
Gran Fiesta Tour Starring The Three Caballeros
Average Posted Wait
14
7-Day Rank
#1
30-Day Rank
#3
365-Day Rank
#57
Journey Into Imagination With Figment
Average Posted Wait
26
7-Day Rank
#1
30-Day Rank
#6
365-Day Rank
#31
Living with the Land
Average Posted Wait
18
7-Day Rank
#1
30-Day Rank
#3
365-Day Rank
#50
Mission: SPACE Orange
Average Posted Wait
48
7-Day Rank
#1
30-Day Rank
#2
365-Day Rank
#30
Soarin’
Average Posted Wait
52
Actual Waits Were
66%
7-Day Rank
#1
30-Day Rank
#9
365-Day Rank
#49
Spaceship Earth
Average Posted Wait
24
7-Day Rank
#1
30-Day Rank
#12
365-Day Rank
#89
Test Track
Average Posted Wait
72
Actual Waits Were
45%
7-Day Rank
#1
30-Day Rank
#11
365-Day Rank
#44
The Seas with Nemo & Friends
Average Posted Wait
11
7-Day Rank
#2
30-Day Rank
#15
365-Day Rank
#140
Frozen Ever After
Average Posted Wait
43
7-Day Rank
#4
30-Day Rank
#27
365-Day Rank
#181

The post Holiday Crowds! – Disney World Wait Times for Monday, December 21, 2020 appeared first on TouringPlans.com Blog.