Crowds Pause at Parks – Disney World Wait Times for Thursday, December 24, 2020

Crowds seem to have stayed away from most of Walt Disney World’s parks today.  Posted wait times at Animal Kingdom were lowest of the past month, while EPCOT’s were not much higher (and were overinflated, too).  Hollywood Studios had respectable crowds, and the Magic Kingdom is as popular as ever.  We counted 493 of 500 (99%) guests in Hollywood Studios wearing masks according to Disney’s guidelines.  And we got 119 actual wait times in line from our fabulous Liner community.  Let’s do the numbers!

Magic Kingdom Wait Times

Splash Mountain may have had the highest posted wait times of the day, but those posted waits were more than double the actual waits we measured today.  Splash Mountain had an average wait time today of 88 minutes. Its 7-day average is 62 minutes, so today ranks #1 for this week. We received 5 actual wait times today, and the actual wait averaged 41% of the posted wait time.

Magic Kingdom wait times for Thursday, December 24, 2020
Astro Orbiter
Average Posted Wait
43
7-Day Rank
#3
30-Day Rank
#3
365-Day Rank
#16
Big Thunder Mountain Railroad
Average Posted Wait
57
Actual Waits Were
56%
7-Day Rank
#4
30-Day Rank
#7
365-Day Rank
#73
Buzz Lightyear’s Space Ranger Spin
Average Posted Wait
43
Actual Waits Were
49%
7-Day Rank
#4
30-Day Rank
#6
365-Day Rank
#78
Prince Charming Regal Carrousel
Average Posted Wait
50
7-Day Rank
#1
30-Day Rank
#1
365-Day Rank
#1
Dumbo the Flying Elephant
Average Posted Wait
20
7-Day Rank
#4
30-Day Rank
#4
365-Day Rank
#87
“it’s a small world”
Average Posted Wait
51
7-Day Rank
#3
30-Day Rank
#3
365-Day Rank
#11
Jungle Cruise
Average Posted Wait
56
7-Day Rank
#2
30-Day Rank
#2
365-Day Rank
#77
Mad Tea Party
Average Posted Wait
21
7-Day Rank
#3
30-Day Rank
#3
365-Day Rank
#42
Mickey’s PhilharMagic
Average Posted Wait
34
7-Day Rank
#1
30-Day Rank
#1
365-Day Rank
#1
Peter Pan’s Flight
Average Posted Wait
44
Actual Waits Were
114%
7-Day Rank
#3
30-Day Rank
#4
365-Day Rank
#89
Pirates of the Caribbean
Average Posted Wait
52
Actual Waits Were
94%
7-Day Rank
#4
30-Day Rank
#8
365-Day Rank
#64
Space Mountain
Average Posted Wait
55
Actual Waits Were
68%
7-Day Rank
#4
30-Day Rank
#6
365-Day Rank
#95
Splash Mountain
Average Posted Wait
88
Actual Waits Were
41%
7-Day Rank
#1
30-Day Rank
#1
365-Day Rank
#14
The Barnstormer
Average Posted Wait
31
7-Day Rank
#4
30-Day Rank
#4
365-Day Rank
#69
The Haunted Mansion
Average Posted Wait
31
Actual Waits Were
71%
7-Day Rank
#2
30-Day Rank
#8
365-Day Rank
#143
The Magic Carpets of Aladdin
Average Posted Wait
15
7-Day Rank
#3
30-Day Rank
#5
365-Day Rank
#108
The Many Adventures of Winnie the Pooh
Average Posted Wait
30
7-Day Rank
#3
30-Day Rank
#8
365-Day Rank
#98
Tomorrowland Speedway
Average Posted Wait
19
7-Day Rank
#7
30-Day Rank
#12
365-Day Rank
#115
Seven Dwarfs Mine Train
Average Posted Wait
84
Actual Waits Were
73%
7-Day Rank
#3
30-Day Rank
#4
365-Day Rank
#89
Under the Sea ~ Journey of the Little Mermaid
Average Posted Wait
29
7-Day Rank
#4
30-Day Rank
#6
365-Day Rank
#75

Animal Kingdom Wait Times

To illustrate how slow it was at Animal Kingdom today, Avatar Flight of Passage had an average wait time today of 26 minutes. Its 7-day average is 74 minutes, so today ranks #6 for this week. Its 30-day average is 68 minutes, so today ranks #27 for the past month. But even then, we received 4 actual wait times today, and the actual wait averaged just 51% of the posted wait time.

Animal Kingdom wait times for Thursday, December 24, 2020
DINOSAUR
Average Posted Wait
10
7-Day Rank
#6
30-Day Rank
#29
365-Day Rank
#200
Expedition Everest – Legend of the Forbidden Mountain
Average Posted Wait
19
7-Day Rank
#6
30-Day Rank
#27
365-Day Rank
#193
Kali River Rapids
Average Posted Wait
12
7-Day Rank
#4
30-Day Rank
#18
365-Day Rank
#124
Kilimanjaro Safaris
Average Posted Wait
8
7-Day Rank
#6
30-Day Rank
#27
365-Day Rank
#240
It’s Tough to Be a Bug!
Average Posted Wait
10
7-Day Rank
#6
30-Day Rank
#28
365-Day Rank
#211
TriceraTop Spin
Average Posted Wait
5
7-Day Rank
#2
30-Day Rank
#17
365-Day Rank
#110
Na’vi River Journey
Average Posted Wait
37
Actual Waits Were
84%
7-Day Rank
#6
30-Day Rank
#27
365-Day Rank
#177
Avatar Flight of Passage
Average Posted Wait
26
Actual Waits Were
51%
7-Day Rank
#6
30-Day Rank
#27
365-Day Rank
#196

Hollywood Studios Wait Times

Mickey & Minnie’s Runaway Railway had an average wait time today of 37 minutes. Its 7-day average is 47 minutes, so today ranks #6 for this week. Its 30-day average is 48 minutes, so today ranks #27 for the past month. Its 365-day average is 66 minutes, so today ranks #174 for the past year. We received 5 actual wait times today, and the actual wait averaged 63% of the posted wait time.

Hollywood Studios wait times for Thursday, December 24, 2020

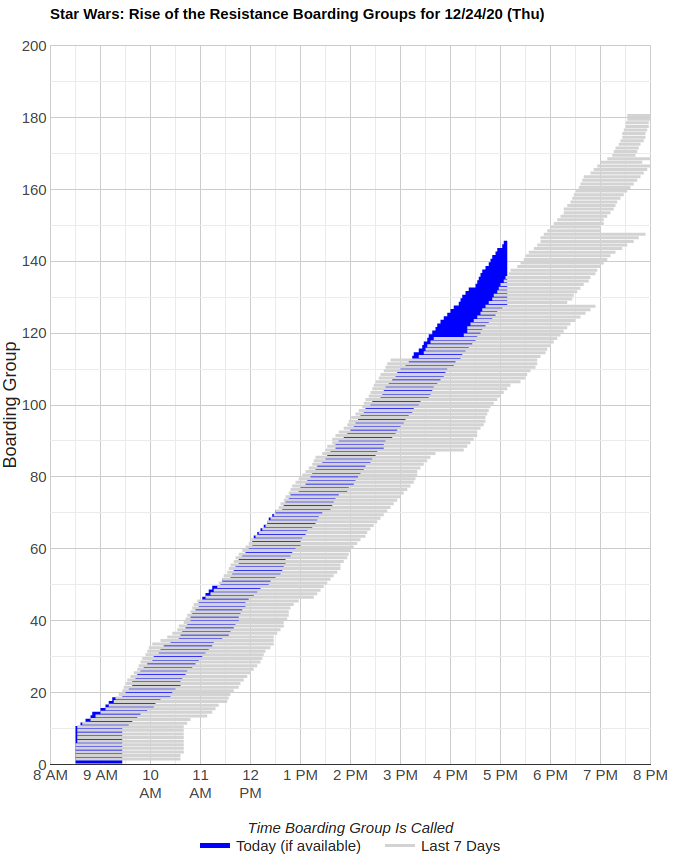
Rise of the Resistance had an excellent day of operations, with no delays in calling boarding groups.  Boarding group 1 was called at 8:30 a.m., and as I write this we were up to boarding group 143 at 5 p.m.  Rise didn’t even have its usual 3 p.m. pause, which (I think ) is the first time there hasn’t been an afternoon pause in a long while.

Rise of the Resistance boarding groups for Thursday, December 24, 2020
Muppet*Vision 3D
Average Posted Wait
36
7-Day Rank
#1
30-Day Rank
#1
365-Day Rank
#1
Rock ‘n’ Roller Coaster Starring Aerosmith
Average Posted Wait
45
7-Day Rank
#4
30-Day Rank
#17
365-Day Rank
#159
Star Tours: The Adventures Continue
Average Posted Wait
39
Actual Waits Were
65%
7-Day Rank
#2
30-Day Rank
#2
365-Day Rank
#31
The Twilight Zone Tower of Terror
Average Posted Wait
61
7-Day Rank
#5
30-Day Rank
#12
365-Day Rank
#84
Toy Story Mania!
Average Posted Wait
30
Actual Waits Were
62%
7-Day Rank
#4
30-Day Rank
#5
365-Day Rank
#110
Slinky Dog Dash
Average Posted Wait
65
Actual Waits Were
75%
7-Day Rank
#3
30-Day Rank
#17
365-Day Rank
#135
Alien Swirling Saucers
Average Posted Wait
30
7-Day Rank
#5
30-Day Rank
#8
365-Day Rank
#92
Mickey & Minnie’s Runaway Railway
Average Posted Wait
37
Actual Waits Were
63%
7-Day Rank
#6
30-Day Rank
#27
365-Day Rank
#174
Millennium Falcon: Smugglers Run
Average Posted Wait
68
7-Day Rank
#5
30-Day Rank
#6
365-Day Rank
#63

EPCOT Wait Times

EPCOT’s just not busy today.  Soarin’ had an average wait time today of 34 minutes. Its 7-day average is 41 minutes, so today ranks #4 for this week. Its 30-day average is 45 minutes, so today ranks #24 for the past month. And we received 6 actual wait times today, and the actual wait averaged 56% of the posted wait time.

EPCOT wait times for Thursday, December 24, 2020
Gran Fiesta Tour Starring The Three Caballeros
Average Posted Wait
6
7-Day Rank
#5
30-Day Rank
#23
365-Day Rank
#187
Journey Into Imagination With Figment
Average Posted Wait
15
7-Day Rank
#4
30-Day Rank
#18
365-Day Rank
#108
Living with the Land
Average Posted Wait
8
Actual Waits Were
55%
7-Day Rank
#3
30-Day Rank
#26
365-Day Rank
#217
Mission: SPACE Orange
Average Posted Wait
41
7-Day Rank
#2
30-Day Rank
#5
365-Day Rank
#40
Soarin’
Average Posted Wait
34
Actual Waits Were
56%
7-Day Rank
#4
30-Day Rank
#24
365-Day Rank
#130
Spaceship Earth
Average Posted Wait
15
Actual Waits Were
38%
7-Day Rank
#3
30-Day Rank
#23
365-Day Rank
#142
Test Track
Average Posted Wait
57
Actual Waits Were
63%
7-Day Rank
#5
30-Day Rank
#23
365-Day Rank
#90
The Seas with Nemo & Friends
Average Posted Wait
5
7-Day Rank
#6
30-Day Rank
#28
365-Day Rank
#240
Mission: SPACE Green
Average Posted Wait
15
7-Day Rank
#5
30-Day Rank
#16
365-Day Rank
#67
Frozen Ever After
Average Posted Wait
26
Actual Waits Were
61%
7-Day Rank
#5
30-Day Rank
#28
365-Day Rank
#222

The post Crowds Pause at Parks – Disney World Wait Times for Thursday, December 24, 2020 appeared first on TouringPlans.com Blog.