7DMT Has 100-Minute Lines! Disney World Wait Times for Tuesday, December 29, 2020

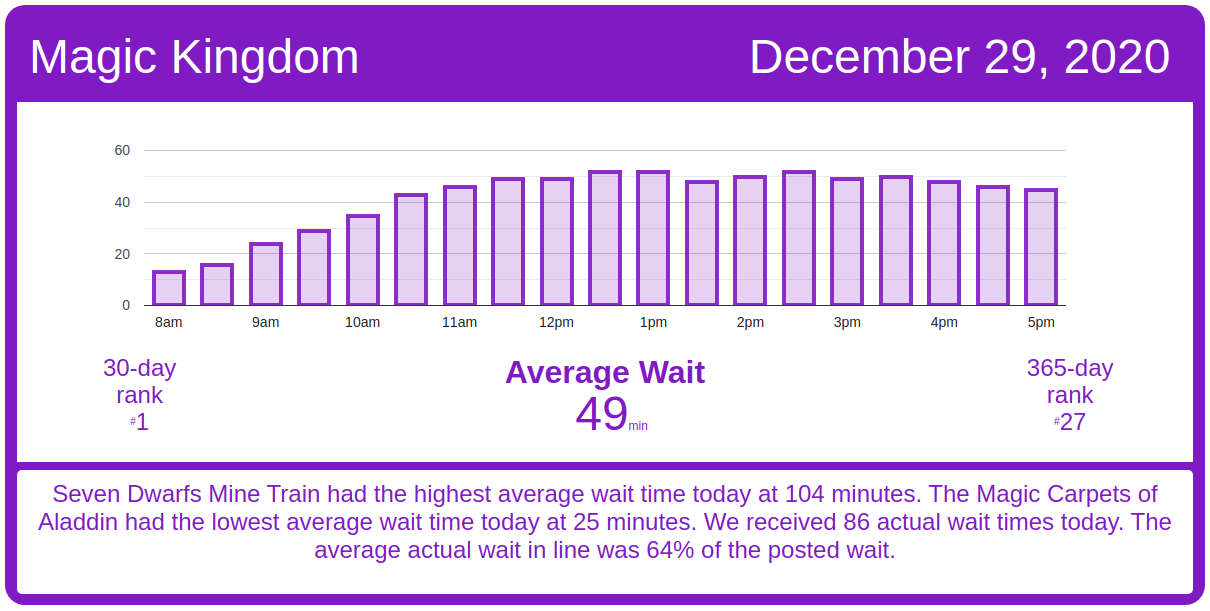
It was the busiest day of the past month at the Magic Kingdom and Animal Kingdom today.  Seven Dwarfs Mine Train’s average posted wait time was 104 minutes. The good news is that actual wait times in line were about a third lower than the posted waits we measured.  We received 156 actual wait times from Liners today. Let’s do the numbers!

Magic Kingdom Wait Times

Big Thunder Mountain Railroad had an average wait time today of 68 minutes. Its 7-day average is 58 minutes, so today ranks #1 for this week. But we received 12 actual wait times today, and the actual wait averaged 45% of the posted wait time, so actual waits were less than half of the posted wait.

Magic Kingdom wait times for Tuesday, December 29, 2020
Astro Orbiter
Average Posted Wait
44
7-Day Rank
#2
30-Day Rank
#4
365-Day Rank
#12
Big Thunder Mountain Railroad
Average Posted Wait
68
Actual Waits Were
45%
7-Day Rank
#1
30-Day Rank
#3
365-Day Rank
#42
Buzz Lightyear’s Space Ranger Spin
Average Posted Wait
47
Actual Waits Were
52%
7-Day Rank
#1
30-Day Rank
#2
365-Day Rank
#56
Dumbo the Flying Elephant
Average Posted Wait
26
7-Day Rank
#1
30-Day Rank
#3
365-Day Rank
#65
“it’s a small world”
Average Posted Wait
54
7-Day Rank
#1
30-Day Rank
#3
365-Day Rank
#7
Jungle Cruise
Average Posted Wait
60
7-Day Rank
#1
30-Day Rank
#2
365-Day Rank
#70
Mad Tea Party
Average Posted Wait
26
7-Day Rank
#1
30-Day Rank
#2
365-Day Rank
#22
Mickey’s PhilharMagic
Average Posted Wait
35
7-Day Rank
#1
30-Day Rank
#1
365-Day Rank
#1
Peter Pan’s Flight
Average Posted Wait
55
Actual Waits Were
72%
7-Day Rank
#1
30-Day Rank
#1
365-Day Rank
#75
Pirates of the Caribbean
Average Posted Wait
65
Actual Waits Were
71%
7-Day Rank
#1
30-Day Rank
#1
365-Day Rank
#6
Space Mountain
Average Posted Wait
77
Actual Waits Were
89%
7-Day Rank
#1
30-Day Rank
#2
365-Day Rank
#58
Splash Mountain
Average Posted Wait
84
Actual Waits Were
54%
7-Day Rank
#2
30-Day Rank
#3
365-Day Rank
#13
The Barnstormer
Average Posted Wait
38
7-Day Rank
#1
30-Day Rank
#3
365-Day Rank
#36
The Hall of Presidents
Average Posted Wait
35
7-Day Rank
#1
30-Day Rank
#1
365-Day Rank
#1
The Haunted Mansion
Average Posted Wait
37
Actual Waits Were
53%
7-Day Rank
#1
30-Day Rank
#2
365-Day Rank
#118
The Magic Carpets of Aladdin
Average Posted Wait
25
7-Day Rank
#1
30-Day Rank
#1
365-Day Rank
#68
The Many Adventures of Winnie the Pooh
Average Posted Wait
33
7-Day Rank
#1
30-Day Rank
#3
365-Day Rank
#81
Tomorrowland Speedway
Average Posted Wait
29
Actual Waits Were
45%
7-Day Rank
#2
30-Day Rank
#5
365-Day Rank
#66
Seven Dwarfs Mine Train
Average Posted Wait
104
7-Day Rank
#1
30-Day Rank
#1
365-Day Rank
#69
Under the Sea ~ Journey of the Little Mermaid
Average Posted Wait
32
Actual Waits Were
32%
7-Day Rank
#2
30-Day Rank
#5
365-Day Rank
#52

Animal Kingdom Wait Times

Expedition Everest had an average wait time today of 47 minutes. Its 7-day average is 30 minutes, so today ranks #1 for this week. We received 5 actual wait times today, and the actual wait averaged 42% of the posted wait time.

Animal Kingdom wait times for Tuesday, December 29, 2020
DINOSAUR
Average Posted Wait
75
Actual Waits Were
75%
7-Day Rank
#1
30-Day Rank
#1
365-Day Rank
#2
Expedition Everest – Legend of the Forbidden Mountain
Average Posted Wait
47
Actual Waits Were
42%
7-Day Rank
#1
30-Day Rank
#2
365-Day Rank
#77
Kali River Rapids
Average Posted Wait
29
7-Day Rank
#1
30-Day Rank
#1
365-Day Rank
#26
Kilimanjaro Safaris
Average Posted Wait
47
Actual Waits Were
45%
7-Day Rank
#1
30-Day Rank
#1
365-Day Rank
#74
It’s Tough to Be a Bug!
Average Posted Wait
41
7-Day Rank
#1
30-Day Rank
#1
365-Day Rank
#1
TriceraTop Spin
Average Posted Wait
11
7-Day Rank
#1
30-Day Rank
#2
365-Day Rank
#39
Na’vi River Journey
Average Posted Wait
84
7-Day Rank
#1
30-Day Rank
#2
365-Day Rank
#47
Avatar Flight of Passage
Average Posted Wait
89
7-Day Rank
#1
30-Day Rank
#1
365-Day Rank
#84

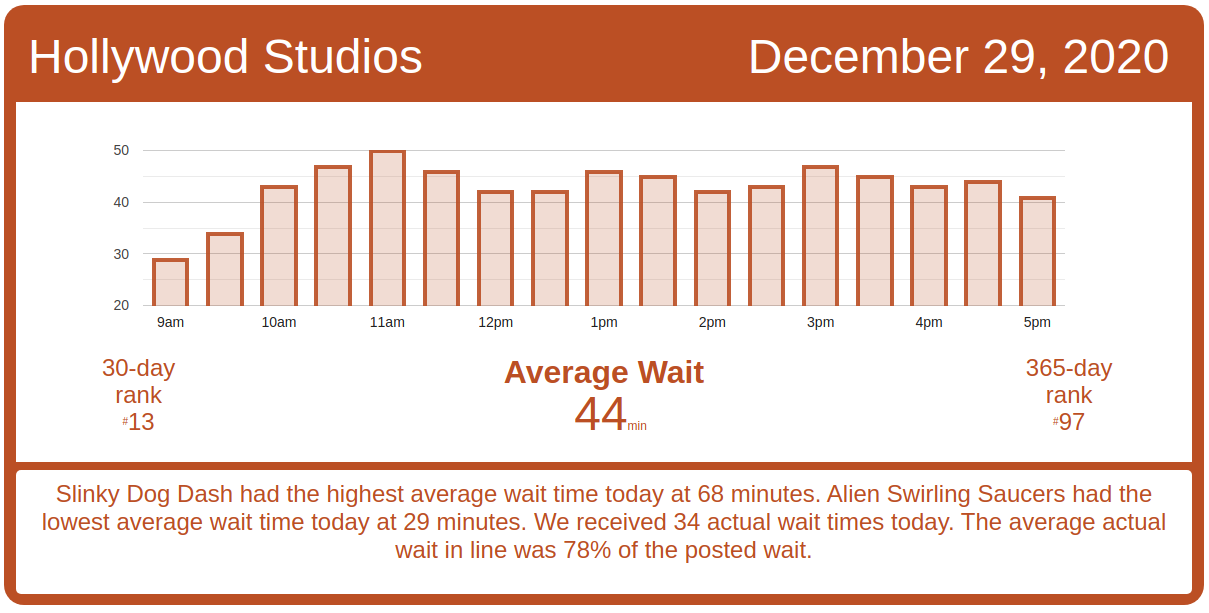
Hollywood Studios Wait Times

Slinky Dog Dash had an average wait time today of 68 minutes. Its 7-day average is 64 minutes, so today ranks #2 for this week. Its 30-day average is 65 minutes, so today ranks #14 for the past month. Its 365-day average is 70 minutes, so today ranks #125 for the past year. We received 6 actual wait times today, and the actual wait averaged 77% of the posted wait time.

Hollywood Studios wait times for Tuesday, December 29, 2020

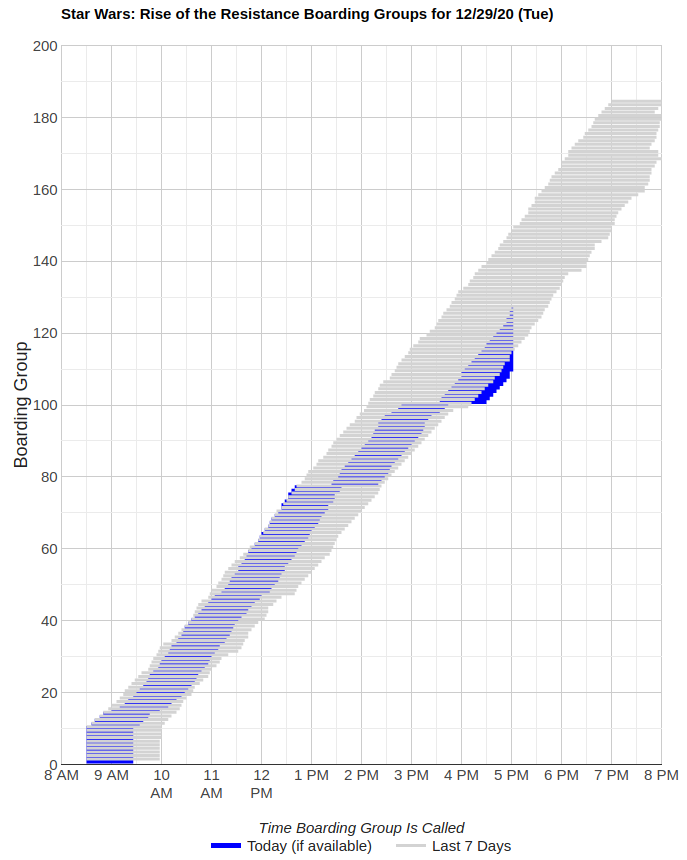
Rise of the Resistance boarding groups started at 8:30 a.m. this morning, and ran steady through 12:30 p.m., when it encountered a delay of about 50 minutes in calling boarding groups.  Once Rise resumed calling boarding groups, things ran smoothly until just before 3 p.m.  That’s the usual time for a pause in boarding groups anyway, and things started up again at 3:30 p.m.  As I write this, Rise is up to boarding group 130.

Rise of the Resistance boarding groups for Tuesday, December 29, 2020
Muppet*Vision 3D
Average Posted Wait
32
7-Day Rank
#2
30-Day Rank
#5
365-Day Rank
#5
Rock ‘n’ Roller Coaster Starring Aerosmith
Average Posted Wait
47
7-Day Rank
#3
30-Day Rank
#15
365-Day Rank
#149
Star Tours: The Adventures Continue
Average Posted Wait
35
Actual Waits Were
67%
7-Day Rank
#4
30-Day Rank
#10
365-Day Rank
#46
The Twilight Zone Tower of Terror
Average Posted Wait
65
7-Day Rank
#2
30-Day Rank
#6
365-Day Rank
#62
Toy Story Mania!
Average Posted Wait
36
Actual Waits Were
70%
7-Day Rank
#2
30-Day Rank
#5
365-Day Rank
#86
Slinky Dog Dash
Average Posted Wait
68
Actual Waits Were
77%
7-Day Rank
#2
30-Day Rank
#14
365-Day Rank
#125
Alien Swirling Saucers
Average Posted Wait
29
Actual Waits Were
48%
7-Day Rank
#6
30-Day Rank
#15
365-Day Rank
#97
Mickey & Minnie’s Runaway Railway
Average Posted Wait
44
7-Day Rank
#2
30-Day Rank
#20
365-Day Rank
#158
Millennium Falcon: Smugglers Run
Average Posted Wait
65
7-Day Rank
#3
30-Day Rank
#10
365-Day Rank
#76

EPCOT Wait Times

EPCOT’s actual wait times continue to be about half of the posted wait time.  Soarin’ had an average wait time today of 82 minutes. Its 7-day average is 45 minutes, so today ranks #1 for this week. Its 30-day average is 43 minutes, so today ranks #1 for the past month. Its 365-day average is 37 minutes, so today ranks #5 for the past year. We received 4 actual wait times today, and the actual wait averaged 53% of the posted wait time.

EPCOT wait times for Tuesday, December 29, 2020
Gran Fiesta Tour Starring The Three Caballeros
Average Posted Wait
15
7-Day Rank
#1
30-Day Rank
#4
365-Day Rank
#32
Journey Into Imagination With Figment
Average Posted Wait
42
7-Day Rank
#1
30-Day Rank
#1
365-Day Rank
#1
Living with the Land
Average Posted Wait
15
7-Day Rank
#1
30-Day Rank
#8
365-Day Rank
#84
Mission: SPACE Orange
Average Posted Wait
76
7-Day Rank
#1
30-Day Rank
#1
365-Day Rank
#1
Soarin’
Average Posted Wait
82
Actual Waits Were
53%
7-Day Rank
#1
30-Day Rank
#1
365-Day Rank
#5
Spaceship Earth
Average Posted Wait
49
7-Day Rank
#1
30-Day Rank
#1
365-Day Rank
#3
Test Track
Average Posted Wait
119
7-Day Rank
#1
30-Day Rank
#1
365-Day Rank
#2
The Seas with Nemo & Friends
Average Posted Wait
29
7-Day Rank
#1
30-Day Rank
#1
365-Day Rank
#15
Mission: SPACE Green
Average Posted Wait
30
7-Day Rank
#2
30-Day Rank
#3
365-Day Rank
#14
Frozen Ever After
Average Posted Wait
61
7-Day Rank
#1
30-Day Rank
#17
365-Day Rank
#121

The post 7DMT Has 100-Minute Lines! Disney World Wait Times for Tuesday, December 29, 2020 appeared first on TouringPlans.com Blog.