Slowest Day of Past Month! Disney World Wait Times for Sunday, December 10, 2021

Today appears to have been the slowest day of the past month at Walt Disney World, with no park’s crowds ranking higher than 27th of the past 30 days.  That made it easy to get on rides, and we got 180 actual wait times today from users of our Lines app. We counted 495 of 500 guests (99%) wearing masks in the Magic Kingdom according to Disney’s guidelines.  Let’s do the numbers!

Magic Kingdom Wait Times

Seven Dwarfs Mine Train had an average wait time today of 53 minutes. Its 7-day average is 79 minutes, so today ranks #6 for this week. Its 30-day average is 81 minutes, so today ranks #29 for the past month. Its 365-day average is 73 minutes, so today ranks #157 for the past year. We received 5 actual wait times today, and the actual wait averaged 89% of the posted wait time.

Magic Kingdom wait times for Sunday, January 10, 2021
Astro Orbiter
Average Posted Wait
31
7-Day Rank
#6
30-Day Rank
#29
365-Day Rank
#128
Big Thunder Mountain Railroad
Average Posted Wait
45
Actual Waits Were
91%
7-Day Rank
#6
30-Day Rank
#29
365-Day Rank
#138
Buzz Lightyear’s Space Ranger Spin
Average Posted Wait
25
Actual Waits Were
38%
7-Day Rank
#6
30-Day Rank
#29
365-Day Rank
#163
Dumbo the Flying Elephant
Average Posted Wait
7
7-Day Rank
#5
30-Day Rank
#28
365-Day Rank
#194
“it’s a small world”
Average Posted Wait
30
7-Day Rank
#6
30-Day Rank
#30
365-Day Rank
#163
Jungle Cruise
Average Posted Wait
31
Actual Waits Were
71%
7-Day Rank
#6
30-Day Rank
#29
365-Day Rank
#193
Mad Tea Party
Average Posted Wait
10
7-Day Rank
#4
30-Day Rank
#27
365-Day Rank
#174
Mickey’s PhilharMagic
Average Posted Wait
17
7-Day Rank
#6
30-Day Rank
#29
365-Day Rank
#110
Peter Pan’s Flight
Average Posted Wait
27
Actual Waits Were
91%
7-Day Rank
#6
30-Day Rank
#29
365-Day Rank
#176
Pirates of the Caribbean
Average Posted Wait
37
Actual Waits Were
55%
7-Day Rank
#6
30-Day Rank
#29
365-Day Rank
#179
Space Mountain
Average Posted Wait
37
Actual Waits Were
55%
7-Day Rank
#6
30-Day Rank
#28
365-Day Rank
#144
Splash Mountain
Average Posted Wait
29
Actual Waits Were
42%
7-Day Rank
#6
30-Day Rank
#25
365-Day Rank
#170
The Barnstormer
Average Posted Wait
17
7-Day Rank
#6
30-Day Rank
#28
365-Day Rank
#148
The Haunted Mansion
Average Posted Wait
17
Actual Waits Were
32%
7-Day Rank
#5
30-Day Rank
#28
365-Day Rank
#210
The Magic Carpets of Aladdin
Average Posted Wait
13
7-Day Rank
#5
30-Day Rank
#24
365-Day Rank
#144
The Many Adventures of Winnie the Pooh
Average Posted Wait
19
7-Day Rank
#6
30-Day Rank
#29
365-Day Rank
#187
Tomorrowland Speedway
Average Posted Wait
12
Actual Waits Were
117%
7-Day Rank
#5
30-Day Rank
#28
365-Day Rank
#182
Seven Dwarfs Mine Train
Average Posted Wait
53
Actual Waits Were
89%
7-Day Rank
#6
30-Day Rank
#29
365-Day Rank
#157
Under the Sea ~ Journey of the Little Mermaid
Average Posted Wait
17
7-Day Rank
#5
30-Day Rank
#27
365-Day Rank
#169

Animal Kingdom Wait Times

Expedition Everest had an average wait time today of 25 minutes. We received 9 actual wait times today, and the actual wait averaged 26% of the posted wait time. That’s crazy.

Animal Kingdom wait times for Sunday, January 10, 2021
DINOSAUR
Average Posted Wait
37
7-Day Rank
#5
30-Day Rank
#23
365-Day Rank
#105
Expedition Everest – Legend of the Forbidden Mountain
Average Posted Wait
25
Actual Waits Were
26%
7-Day Rank
#4
30-Day Rank
#21
365-Day Rank
#156
Kilimanjaro Safaris
Average Posted Wait
20
Actual Waits Were
55%
7-Day Rank
#4
30-Day Rank
#20
365-Day Rank
#138
It’s Tough to Be a Bug!
Average Posted Wait
11
7-Day Rank
#6
30-Day Rank
#28
365-Day Rank
#145
TriceraTop Spin
Average Posted Wait
5
7-Day Rank
#1
30-Day Rank
#11
365-Day Rank
#101
Na’vi River Journey
Average Posted Wait
51
7-Day Rank
#5
30-Day Rank
#24
365-Day Rank
#111
Avatar Flight of Passage
Average Posted Wait
40
Actual Waits Were
91%
7-Day Rank
#6
30-Day Rank
#27
365-Day Rank
#165

Hollywood Studios Wait Times

Rock ‘n’ Roller Coaster Starring Elton John had an average wait time today of 42 minutes. Its 7-day average is 49 minutes, so today ranks #4 for this week. Its 30-day average is 47 minutes, so today ranks #19 for the past month. We received 4 actual wait times today, and the actual wait averaged 63% of the posted wait time.

Hollywood Studios wait times for Sunday, January 10, 2021

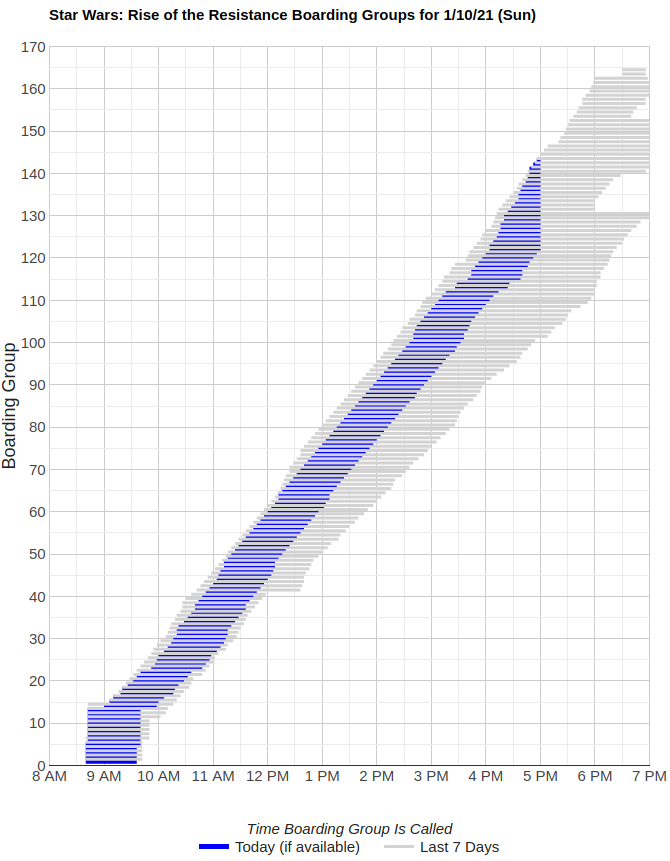
Rise of the Resistance has had one of its best days of operation in its lifetime. There wasn’t even a stop around 3 pm!  As I write this, Rise had already called over 140 boarding groups.  Fantastic day for the ops team.

Rise of the Resistance boarding groups for Sunday, January 10, 2021
Muppet*Vision 3D
Average Posted Wait
22
7-Day Rank
#7
30-Day Rank
#31
365-Day Rank
#37
Rock ‘n’ Roller Coaster Starring Aerosmith
Average Posted Wait
42
Actual Waits Were
63%
7-Day Rank
#4
30-Day Rank
#19
365-Day Rank
#163
Star Tours: The Adventures Continue
Average Posted Wait
31
Actual Waits Were
49%
7-Day Rank
#6
30-Day Rank
#27
365-Day Rank
#87
The Twilight Zone Tower of Terror
Average Posted Wait
57
Actual Waits Were
85%
7-Day Rank
#5
30-Day Rank
#25
365-Day Rank
#91
Toy Story Mania!
Average Posted Wait
27
Actual Waits Were
70%
7-Day Rank
#5
30-Day Rank
#25
365-Day Rank
#143
Slinky Dog Dash
Average Posted Wait
55
Actual Waits Were
44%
7-Day Rank
#6
30-Day Rank
#24
365-Day Rank
#171
Alien Swirling Saucers
Average Posted Wait
24
7-Day Rank
#5
30-Day Rank
#27
365-Day Rank
#157
Mickey & Minnie’s Runaway Railway
Average Posted Wait
45
Actual Waits Were
81%
7-Day Rank
#4
30-Day Rank
#16
365-Day Rank
#164
Millennium Falcon: Smugglers Run
Average Posted Wait
48
Actual Waits Were
84%
7-Day Rank
#6
30-Day Rank
#29
365-Day Rank
#179

EPCOT Wait Times

Frozen Ever After had an average wait time today of 25 minutes. Its 7-day average is 26 minutes, so today ranks #3 for this week. Its 30-day average is 48 minutes, so today ranks #24 for the past month. Its 365-day average is 56 minutes, so today ranks #223 for the past year. We received 5 actual wait times today, and the actual wait averaged 98% of the posted wait time.

EPCOT wait times for Sunday, January 10, 2021
Gran Fiesta Tour Starring The Three Caballeros
Average Posted Wait
10
7-Day Rank
#2
30-Day Rank
#14
365-Day Rank
#108
Journey Into Imagination With Figment
Average Posted Wait
5
7-Day Rank
#6
30-Day Rank
#30
365-Day Rank
#241
Living with the Land
Average Posted Wait
5
7-Day Rank
#6
30-Day Rank
#29
365-Day Rank
#243
Mission: SPACE Orange
Average Posted Wait
28
7-Day Rank
#6
30-Day Rank
#29
365-Day Rank
#107
Soarin’
Average Posted Wait
21
7-Day Rank
#6
30-Day Rank
#29
365-Day Rank
#187
Spaceship Earth
Average Posted Wait
13
7-Day Rank
#6
30-Day Rank
#29
365-Day Rank
#165
Test Track
Average Posted Wait
52
Actual Waits Were
49%
7-Day Rank
#7
30-Day Rank
#30
365-Day Rank
#106
The Seas with Nemo & Friends
Average Posted Wait
5
7-Day Rank
#6
30-Day Rank
#29
365-Day Rank
#239
Frozen Ever After
Average Posted Wait
25
Actual Waits Were
98%
7-Day Rank
#3
30-Day Rank
#24
365-Day Rank
#223

The post Slowest Day of Past Month! Disney World Wait Times for Sunday, December 10, 2021 appeared first on TouringPlans.com Blog.