Week Ends with Low Crowds – Disney World Wait Times for Sunday, January 24, 2021

It was a slow end to the weekend at Walt Disney World today, with each park’s average posted wait times between the middle and bottom of the past month.

We counted 492 of 500 guests (98%) at Hollywood Studios wearing masks according to Disney’s guidelines.  And we got 127 actual wait times from our fabulous Lines community.  Let’s do the rest of the numbers!

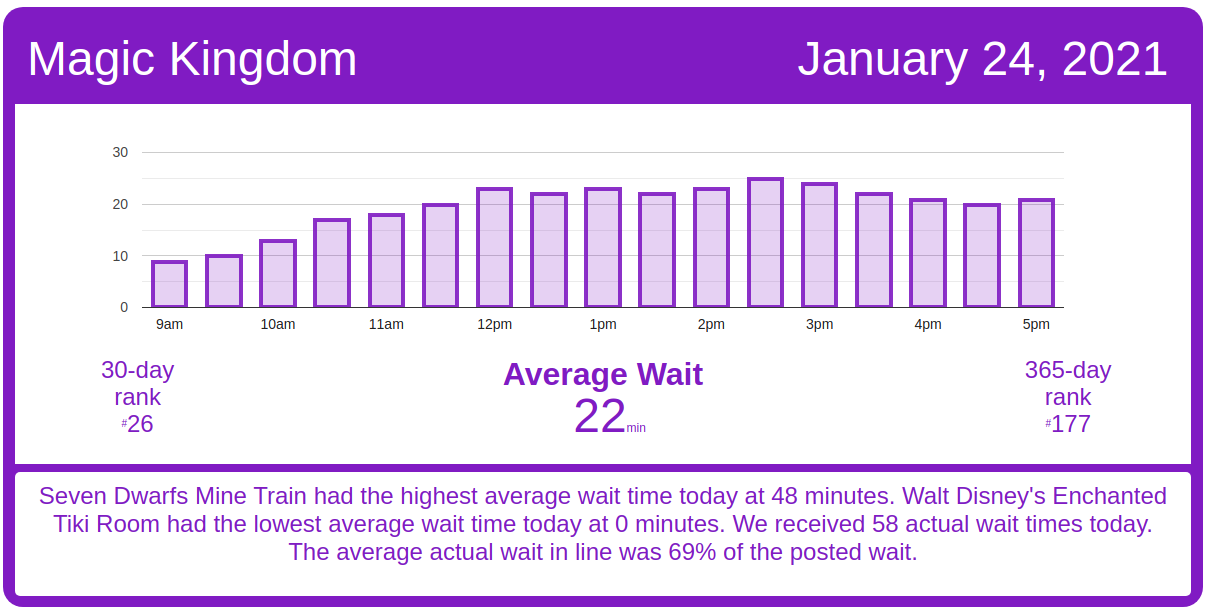
Magic Kingdom Wait Times

Space Mountain had an average wait time today of 26 minutes. Its 7-day average is 28 minutes, so today ranks #4 for this week. Its 30-day average is 49 minutes, so today ranks #25 for the past month. Its 365-day average is 47 minutes, so today ranks #166 for the past year. We received 5 actual wait times today, and the actual wait averaged 31% of the posted wait time.

Magic Kingdom wait times for Sunday, January 24, 2021
Astro Orbiter
Average Posted Wait
32
7-Day Rank
#4
30-Day Rank
#25
365-Day Rank
#125
Big Thunder Mountain Railroad
Average Posted Wait
32
Actual Waits Were
54%
7-Day Rank
#5
30-Day Rank
#27
365-Day Rank
#193
Buzz Lightyear’s Space Ranger Spin
Average Posted Wait
24
7-Day Rank
#4
30-Day Rank
#25
365-Day Rank
#164
Prince Charming Regal Carrousel
Average Posted Wait
25
7-Day Rank
#1
30-Day Rank
#1
365-Day Rank
#1
Dumbo the Flying Elephant
Average Posted Wait
7
7-Day Rank
#5
30-Day Rank
#27
365-Day Rank
#198
“it’s a small world”
Average Posted Wait
28
7-Day Rank
#4
30-Day Rank
#27
365-Day Rank
#176
Jungle Cruise
Average Posted Wait
26
Actual Waits Were
90%
7-Day Rank
#4
30-Day Rank
#26
365-Day Rank
#214
Mad Tea Party
Average Posted Wait
7
7-Day Rank
#4
30-Day Rank
#26
365-Day Rank
#231
Mickey’s PhilharMagic
Average Posted Wait
20
7-Day Rank
#2
30-Day Rank
#22
365-Day Rank
#70
Peter Pan’s Flight
Average Posted Wait
21
Actual Waits Were
97%
7-Day Rank
#4
30-Day Rank
#26
365-Day Rank
#212
Pirates of the Caribbean
Average Posted Wait
33
Actual Waits Were
77%
7-Day Rank
#4
30-Day Rank
#25
365-Day Rank
#190
Space Mountain
Average Posted Wait
26
Actual Waits Were
31%
7-Day Rank
#4
30-Day Rank
#25
365-Day Rank
#166
Splash Mountain
Average Posted Wait
42
Actual Waits Were
93%
7-Day Rank
#1
30-Day Rank
#19
365-Day Rank
#132
The Barnstormer
Average Posted Wait
13
7-Day Rank
#4
30-Day Rank
#24
365-Day Rank
#154
The Haunted Mansion
Average Posted Wait
15
Actual Waits Were
34%
7-Day Rank
#3
30-Day Rank
#23
365-Day Rank
#209
The Magic Carpets of Aladdin
Average Posted Wait
12
7-Day Rank
#3
30-Day Rank
#23
365-Day Rank
#161
The Many Adventures of Winnie the Pooh
Average Posted Wait
17
Actual Waits Were
82%
7-Day Rank
#4
30-Day Rank
#25
365-Day Rank
#202
Tomorrowland Speedway
Average Posted Wait
8
7-Day Rank
#5
30-Day Rank
#28
365-Day Rank
#227
Seven Dwarfs Mine Train
Average Posted Wait
48
7-Day Rank
#4
30-Day Rank
#26
365-Day Rank
#167
Under the Sea ~ Journey of the Little Mermaid
Average Posted Wait
17
7-Day Rank
#2
30-Day Rank
#18
365-Day Rank
#163

Animal Kingdom Wait Times

Kilimanjaro Safaris had an average wait time today of 31 minutes. Its 7-day average is 12 minutes, so today ranks #1 for this week. Its 30-day average is 24 minutes, so today ranks #10 for the past month. Its 365-day average is 35 minutes, so today ranks #79 for the past year. We received 5 actual wait times today, and the actual wait averaged 41% of the posted wait time.

Animal Kingdom wait times for Sunday, January 24, 2021
DINOSAUR
Average Posted Wait
38
7-Day Rank
#2
30-Day Rank
#19
365-Day Rank
#96
Expedition Everest – Legend of the Forbidden Mountain
Average Posted Wait
24
7-Day Rank
#1
30-Day Rank
#16
365-Day Rank
#145
Kilimanjaro Safaris
Average Posted Wait
31
Actual Waits Were
41%
7-Day Rank
#1
30-Day Rank
#10
365-Day Rank
#79
It’s Tough to Be a Bug!
Average Posted Wait
17
7-Day Rank
#1
30-Day Rank
#15
365-Day Rank
#65
TriceraTop Spin
Average Posted Wait
7
7-Day Rank
#1
30-Day Rank
#6
365-Day Rank
#66
Na’vi River Journey
Average Posted Wait
50
Actual Waits Were
108%
7-Day Rank
#1
30-Day Rank
#18
365-Day Rank
#103
Avatar Flight of Passage
Average Posted Wait
42
Actual Waits Were
70%
7-Day Rank
#1
30-Day Rank
#18
365-Day Rank
#151

Hollywood Studios Wait Times

Rock ‘n’ Roller Coaster Starring The Captain and Tennille had an average wait time today of 25 minutes. Its 7-day average is 29 minutes, so today ranks #3 for this week. Its 30-day average is 43 minutes, so today ranks #25 for the past month. We received 4 actual wait times today, and the actual wait averaged 71% of the posted wait time.

Hollywood Studios wait times for Sunday, January 24, 2021

Rise of the Resistance has had a rough day calling boarding groups.  Rise called its first boarding groups around 8:45 a.m., but ran into an hour and twenty-minute delay around boarding group 16 at 9:10 a.m.  While things resumed just before 10:30 a.m., there was another delay from about 11:15 am. until 11:45 a.m.  That pushed Rise into its worst performance of the past week, although things have been running smoothly since just before lunch.

Rise of the Resistance boarding groups for Sunday, January 24, 2021
Muppet*Vision 3D
Average Posted Wait
24
7-Day Rank
#2
30-Day Rank
#25
365-Day Rank
#45
Rock ‘n’ Roller Coaster Starring Aerosmith
Average Posted Wait
25
Actual Waits Were
71%
7-Day Rank
#3
30-Day Rank
#25
365-Day Rank
#219
Star Tours: The Adventures Continue
Average Posted Wait
22
7-Day Rank
#4
30-Day Rank
#27
365-Day Rank
#163
The Twilight Zone Tower of Terror
Average Posted Wait
38
Actual Waits Were
92%
7-Day Rank
#6
30-Day Rank
#29
365-Day Rank
#195
Toy Story Mania!
Average Posted Wait
23
Actual Waits Were
42%
7-Day Rank
#4
30-Day Rank
#26
365-Day Rank
#171
Slinky Dog Dash
Average Posted Wait
49
Actual Waits Were
72%
7-Day Rank
#4
30-Day Rank
#25
365-Day Rank
#181
Alien Swirling Saucers
Average Posted Wait
22
7-Day Rank
#3
30-Day Rank
#23
365-Day Rank
#164
Mickey & Minnie’s Runaway Railway
Average Posted Wait
34
Actual Waits Were
85%
7-Day Rank
#4
30-Day Rank
#26
365-Day Rank
#203
Millennium Falcon: Smugglers Run
Average Posted Wait
36
Actual Waits Were
99%
7-Day Rank
#3
30-Day Rank
#25
365-Day Rank
#213

EPCOT Wait Times

Frozen Ever After had an average wait time today of 24 minutes. Its 7-day average is 24 minutes, so today ranks #3 for this week. Its 30-day average is 33 minutes, so today ranks #17 for the past month. Its 365-day average is 53 minutes, so today ranks #216 for the past year.

EPCOT wait times for Sunday, January 24, 2021
Gran Fiesta Tour Starring The Three Caballeros
Average Posted Wait
13
7-Day Rank
#1
30-Day Rank
#5
365-Day Rank
#56
Journey Into Imagination With Figment
Average Posted Wait
14
7-Day Rank
#1
30-Day Rank
#13
365-Day Rank
#104
Living with the Land
Average Posted Wait
9
7-Day Rank
#1
30-Day Rank
#13
365-Day Rank
#176
Mission: SPACE Orange
Average Posted Wait
26
7-Day Rank
#1
30-Day Rank
#20
365-Day Rank
#114
Soarin’
Average Posted Wait
33
7-Day Rank
#2
30-Day Rank
#15
365-Day Rank
#122
Spaceship Earth
Average Posted Wait
20
7-Day Rank
#3
30-Day Rank
#12
365-Day Rank
#104
Test Track
Average Posted Wait
49
7-Day Rank
#3
30-Day Rank
#25
365-Day Rank
#125
The Seas with Nemo & Friends
Average Posted Wait
10
7-Day Rank
#2
30-Day Rank
#18
365-Day Rank
#138
Frozen Ever After
Average Posted Wait
24
7-Day Rank
#3
30-Day Rank
#17
365-Day Rank
#216

The post Week Ends with Low Crowds – Disney World Wait Times for Sunday, January 24, 2021 appeared first on TouringPlans.com Blog.