Hello, Crowds! Disney World Wait Times for Saturday, February 6, 2021

Crowds returned to Walt Disney World today, buoyed by the weekend and warmer weather. Wait times today at all four parks rank in the top 10 of the past month, and it’s likely waits will get even longer next weekend.

We received 147 actual wait times today from the fabulous Lines app community.  And we counted 476 of 500 guests (95%) wearing masks in the Magic Kingdom according to Disney’s guidelines. (That’s actually low relative to WDW’s recent average.)  Let’s do the rest of the numbers!

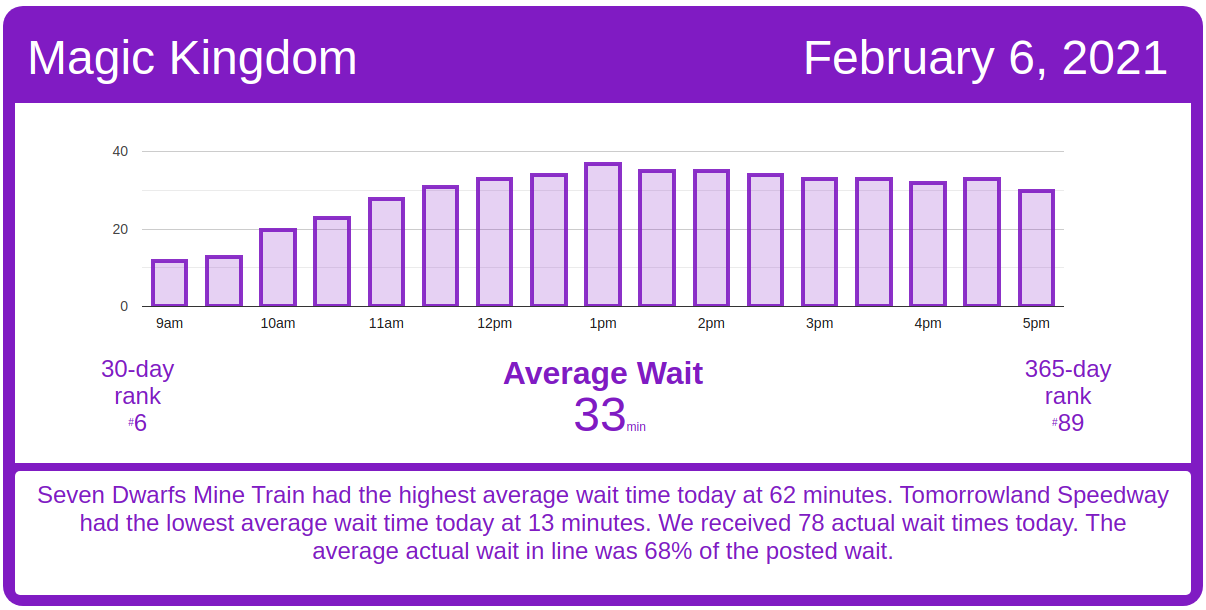
Magic Kingdom Wait Times

Seven Dwarfs Mine Train had an average wait time today of 62 minutes. Its 7-day average is 52 minutes, so today ranks #1 for this week. Its 30-day average is 56 minutes, so today ranks #6 for the past month. But it’s only the 104th-busiest day over the past year. We received 6 actual wait times today, and the actual wait averaged 81% of the posted wait time.

Magic Kingdom wait times for Saturday, February 6. 2021
Astro Orbiter
Average Posted Wait
46
7-Day Rank
#1
30-Day Rank
#2
365-Day Rank
#10
Big Thunder Mountain Railroad
Average Posted Wait
45
Actual Waits Were
53%
7-Day Rank
#1
30-Day Rank
#13
365-Day Rank
#125
Buzz Lightyear’s Space Ranger Spin
Average Posted Wait
39
Actual Waits Were
57%
7-Day Rank
#1
30-Day Rank
#4
365-Day Rank
#71
Dumbo the Flying Elephant
Average Posted Wait
22
Actual Waits Were
67%
7-Day Rank
#1
30-Day Rank
#2
365-Day Rank
#48
“it’s a small world”
Average Posted Wait
38
7-Day Rank
#1
30-Day Rank
#7
365-Day Rank
#108
Jungle Cruise
Average Posted Wait
46
Actual Waits Were
85%
7-Day Rank
#1
30-Day Rank
#2
365-Day Rank
#71
Mad Tea Party
Average Posted Wait
15
7-Day Rank
#1
30-Day Rank
#6
365-Day Rank
#82
Mickey’s PhilharMagic
Average Posted Wait
29
7-Day Rank
#1
30-Day Rank
#3
365-Day Rank
#28
Peter Pan’s Flight
Average Posted Wait
38
7-Day Rank
#1
30-Day Rank
#5
365-Day Rank
#95
Pirates of the Caribbean
Average Posted Wait
46
Actual Waits Were
74%
7-Day Rank
#1
30-Day Rank
#6
365-Day Rank
#112
Space Mountain
Average Posted Wait
38
Actual Waits Were
66%
7-Day Rank
#1
30-Day Rank
#8
365-Day Rank
#123
Splash Mountain
Average Posted Wait
43
Actual Waits Were
63%
7-Day Rank
#2
30-Day Rank
#12
365-Day Rank
#136
The Barnstormer
Average Posted Wait
25
7-Day Rank
#1
30-Day Rank
#5
365-Day Rank
#79
The Haunted Mansion
Average Posted Wait
25
Actual Waits Were
57%
7-Day Rank
#1
30-Day Rank
#4
365-Day Rank
#144
The Magic Carpets of Aladdin
Average Posted Wait
17
7-Day Rank
#1
30-Day Rank
#6
365-Day Rank
#58
The Many Adventures of Winnie the Pooh
Average Posted Wait
27
Actual Waits Were
89%
7-Day Rank
#1
30-Day Rank
#5
365-Day Rank
#96
Tomorrowland Speedway
Average Posted Wait
13
7-Day Rank
#1
30-Day Rank
#15
365-Day Rank
#149
Seven Dwarfs Mine Train
Average Posted Wait
62
Actual Waits Were
81%
7-Day Rank
#1
30-Day Rank
#6
365-Day Rank
#104
Under the Sea ~ Journey of the Little Mermaid
Average Posted Wait
26
Actual Waits Were
27%
7-Day Rank
#1
30-Day Rank
#6
365-Day Rank
#90

Animal Kingdom Wait Times

The posted wait for Na’vi River Journey today was 56 minutes. And that looks to have been pretty accurate – We received 5 actual wait times today, and the actual wait averaged 90% of the posted wait time. Its 7-day average is 41 minutes, so today ranks #1 for this week. Its 30-day average is 44 minutes, so today ranks #4 for the past month. Its 365-day average is 48 minutes, so today ranks #73 for the past year.

Animal Kingdom wait times for Saturday, February 6. 2021
DINOSAUR
Average Posted Wait
42
7-Day Rank
#1
30-Day Rank
#6
365-Day Rank
#74
Expedition Everest – Legend of the Forbidden Mountain
Average Posted Wait
18
Actual Waits Were
61%
7-Day Rank
#1
30-Day Rank
#10
365-Day Rank
#179
Kilimanjaro Safaris
Average Posted Wait
20
7-Day Rank
#1
30-Day Rank
#4
365-Day Rank
#114
It’s Tough to Be a Bug!
Average Posted Wait
17
7-Day Rank
#1
30-Day Rank
#4
365-Day Rank
#66
TriceraTop Spin
Average Posted Wait
5
7-Day Rank
#1
30-Day Rank
#2
365-Day Rank
#79
Na’vi River Journey
Average Posted Wait
56
Actual Waits Were
90%
7-Day Rank
#1
30-Day Rank
#4
365-Day Rank
#73
Avatar Flight of Passage
Average Posted Wait
47
Actual Waits Were
78%
7-Day Rank
#1
30-Day Rank
#5
365-Day Rank
#125

Hollywood Studios Wait Times

Rock ‘n’ Roller Coaster Starring Debbie Gibson had an average wait time today of 36 minutes. Its 7-day average is 28 minutes, so today ranks #1 for this week. Its 30-day average is 33 minutes, so today ranks #9 for the past month. Its 365-day average is 49 minutes, so today ranks #162 for the past year. We received 4 actual wait times today, and the actual wait averaged 68% of the posted wait time.

Hollywood Studios wait times for Saturday, February 6. 2021

Rise of the Resistance is having a good day of operations. Rise began calling boarding groups on time at 8:45 a.m., and ran continuously through 1:30 p.m. and boarding group 80.  It looks like there was a pause then of about 35 minutes, until just after 2 p.m.  Rise of the Resistance has called boarding groups steadily since then, and is at boarding group 135 as I write this.  It looks like Rise will call above 160 boarding groups again today.

Rise of the Resistance boarding groups for Saturday, February 6. 2021
Muppet*Vision 3D
Average Posted Wait
26
7-Day Rank
#2
30-Day Rank
#9
365-Day Rank
#40
Rock ‘n’ Roller Coaster Starring Aerosmith
Average Posted Wait
36
Actual Waits Were
68%
7-Day Rank
#1
30-Day Rank
#9
365-Day Rank
#162
Star Tours: The Adventures Continue
Average Posted Wait
36
Actual Waits Were
63%
7-Day Rank
#1
30-Day Rank
#3
365-Day Rank
#39
The Twilight Zone Tower of Terror
Average Posted Wait
53
7-Day Rank
#2
30-Day Rank
#10
365-Day Rank
#90
Toy Story Mania!
Average Posted Wait
27
Actual Waits Were
65%
7-Day Rank
#1
30-Day Rank
#10
365-Day Rank
#127
Slinky Dog Dash
Average Posted Wait
53
7-Day Rank
#1
30-Day Rank
#11
365-Day Rank
#159
Alien Swirling Saucers
Average Posted Wait
26
7-Day Rank
#1
30-Day Rank
#1
365-Day Rank
#93
Mickey & Minnie’s Runaway Railway
Average Posted Wait
44
Actual Waits Were
88%
7-Day Rank
#1
30-Day Rank
#8
365-Day Rank
#176
Millennium Falcon: Smugglers Run
Average Posted Wait
50
7-Day Rank
#1
30-Day Rank
#7
365-Day Rank
#149

EPCOT Wait Times

Wait times at EPCOT were higher than they’ve been, but still not high in the absolute sense.  Test Track had an average wait time today of 52 minutes. Its 7-day average is 44 minutes, so today ranks #1 for this week. Its 30-day average is 49 minutes, so today ranks #11 for the past month. Its 365-day average is 54 minutes, so today ranks #114 for the past year.

EPCOT wait times for Saturday, February 6. 2021
Gran Fiesta Tour Starring The Three Caballeros
Average Posted Wait
5
7-Day Rank
#5
30-Day Rank
#22
365-Day Rank
#228
Journey Into Imagination With Figment
Average Posted Wait
14
7-Day Rank
#1
30-Day Rank
#6
365-Day Rank
#95
Living with the Land
Average Posted Wait
8
7-Day Rank
#1
30-Day Rank
#8
365-Day Rank
#199
Mission: SPACE Orange
Average Posted Wait
28
7-Day Rank
#1
30-Day Rank
#6
365-Day Rank
#92
Soarin’
Average Posted Wait
34
7-Day Rank
#1
30-Day Rank
#7
365-Day Rank
#110
Spaceship Earth
Average Posted Wait
19
7-Day Rank
#1
30-Day Rank
#9
365-Day Rank
#103
Test Track
Average Posted Wait
52
7-Day Rank
#1
30-Day Rank
#11
365-Day Rank
#114
The Seas with Nemo & Friends
Average Posted Wait
5
7-Day Rank
#6
30-Day Rank
#29
365-Day Rank
#239
Frozen Ever After
Average Posted Wait
30
7-Day Rank
#1
30-Day Rank
#7
365-Day Rank
#181

The post Hello, Crowds! Disney World Wait Times for Saturday, February 6, 2021 appeared first on TouringPlans.com Blog.