An Abnormal Day for Data – Disney World Wait Times for Sunday, March 7, 2021

We had a delay in collecting posted wait times this morning, so take the posted wait averages below with a grain of salt.  Most of the wait times we collected were from this afternoon, when waits are normally higher than in the morning.  That will skew the averages higher, making the parks look busier than they were.  And Rise of the Resistance is having one of its worst days in a while.

On the bright side, we got 121 actual wait times from our fabulous Lines community today! Let’s do the rest of the numbers!

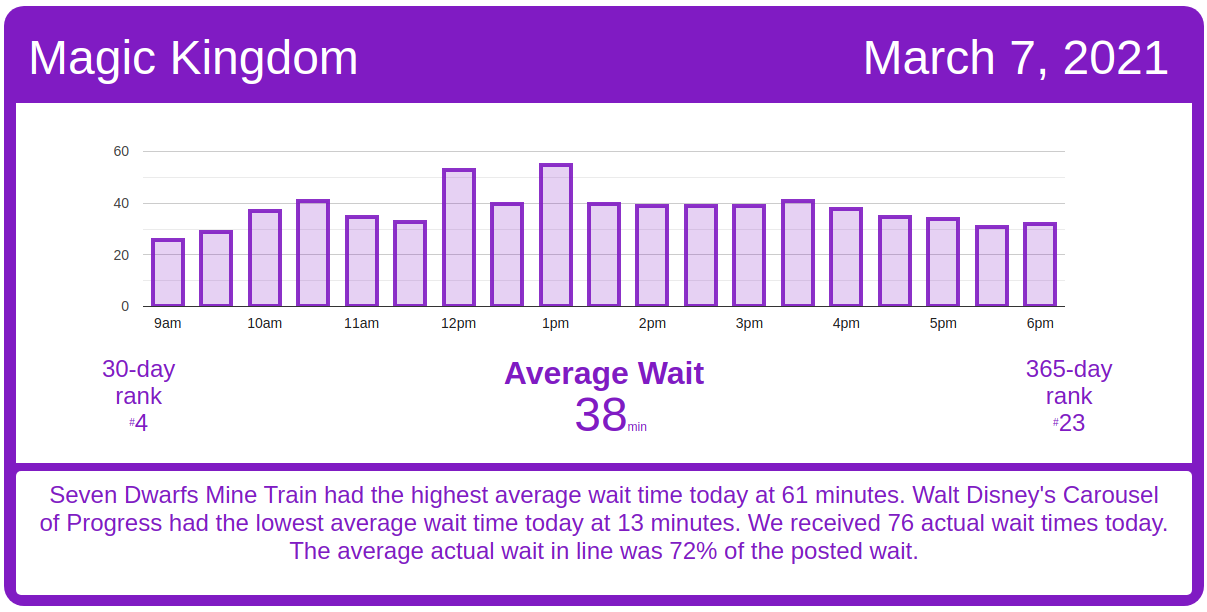
Magic Kingdom Wait Times

Seven Dwarfs Mine Train had an average wait time today of 61 minutes. Its 7-day average is 59 minutes, so today ranks #2 for this week. Its 30-day average is 69 minutes, so today ranks #19 for the past month. Its 365-day average is 58 minutes, so today ranks #95 for the past year. We received 5 actual wait times today, and the actual wait averaged 77% of the posted wait time.

Magic Kingdom wait times for Sunday, March 7, 2021
Astro Orbiter
Average Posted Wait
49
7-Day Rank
#1
30-Day Rank
#2
365-Day Rank
#4
Big Thunder Mountain Railroad
Average Posted Wait
41
Actual Waits Were
64%
7-Day Rank
#3
30-Day Rank
#22
365-Day Rank
#141
Buzz Lightyear’s Space Ranger Spin
Average Posted Wait
46
Actual Waits Were
73%
7-Day Rank
#1
30-Day Rank
#8
365-Day Rank
#20
Prince Charming Regal Carrousel
Average Posted Wait
40
7-Day Rank
#1
30-Day Rank
#1
365-Day Rank
#1
Dumbo the Flying Elephant
Average Posted Wait
25
7-Day Rank
#1
30-Day Rank
#6
365-Day Rank
#17
“it’s a small world”
Average Posted Wait
38
7-Day Rank
#5
30-Day Rank
#23
365-Day Rank
#102
Jungle Cruise
Average Posted Wait
48
Actual Waits Were
63%
7-Day Rank
#1
30-Day Rank
#12
365-Day Rank
#46
Mad Tea Party
Average Posted Wait
18
7-Day Rank
#2
30-Day Rank
#12
365-Day Rank
#38
Mickey’s PhilharMagic
Average Posted Wait
35
7-Day Rank
#1
30-Day Rank
#1
365-Day Rank
#1
Peter Pan’s Flight
Average Posted Wait
44
7-Day Rank
#1
30-Day Rank
#7
365-Day Rank
#36
Pirates of the Caribbean
Average Posted Wait
56
Actual Waits Were
92%
7-Day Rank
#1
30-Day Rank
#14
365-Day Rank
#34
Tom Sawyer Island
Average Posted Wait
48
7-Day Rank
#1
30-Day Rank
#1
365-Day Rank
#1
Space Mountain
Average Posted Wait
52
Actual Waits Were
81%
7-Day Rank
#1
30-Day Rank
#8
365-Day Rank
#52
Splash Mountain
Average Posted Wait
58
7-Day Rank
#3
30-Day Rank
#18
365-Day Rank
#74
The Barnstormer
Average Posted Wait
23
7-Day Rank
#2
30-Day Rank
#19
365-Day Rank
#84
The Haunted Mansion
Average Posted Wait
39
Actual Waits Were
46%
7-Day Rank
#1
30-Day Rank
#1
365-Day Rank
#50
The Magic Carpets of Aladdin
Average Posted Wait
21
7-Day Rank
#1
30-Day Rank
#6
365-Day Rank
#16
The Many Adventures of Winnie the Pooh
Average Posted Wait
30
Actual Waits Were
82%
7-Day Rank
#2
30-Day Rank
#14
365-Day Rank
#44
Tomorrowland Speedway
Average Posted Wait
33
Actual Waits Were
39%
7-Day Rank
#1
30-Day Rank
#1
365-Day Rank
#10
Walt Disney’s Carousel of Progress
Average Posted Wait
13
7-Day Rank
#1
30-Day Rank
#1
365-Day Rank
#1
Seven Dwarfs Mine Train
Average Posted Wait
61
Actual Waits Were
77%
7-Day Rank
#2
30-Day Rank
#19
365-Day Rank
#95
Under the Sea ~ Journey of the Little Mermaid
Average Posted Wait
26
7-Day Rank
#3
30-Day Rank
#15
365-Day Rank
#72

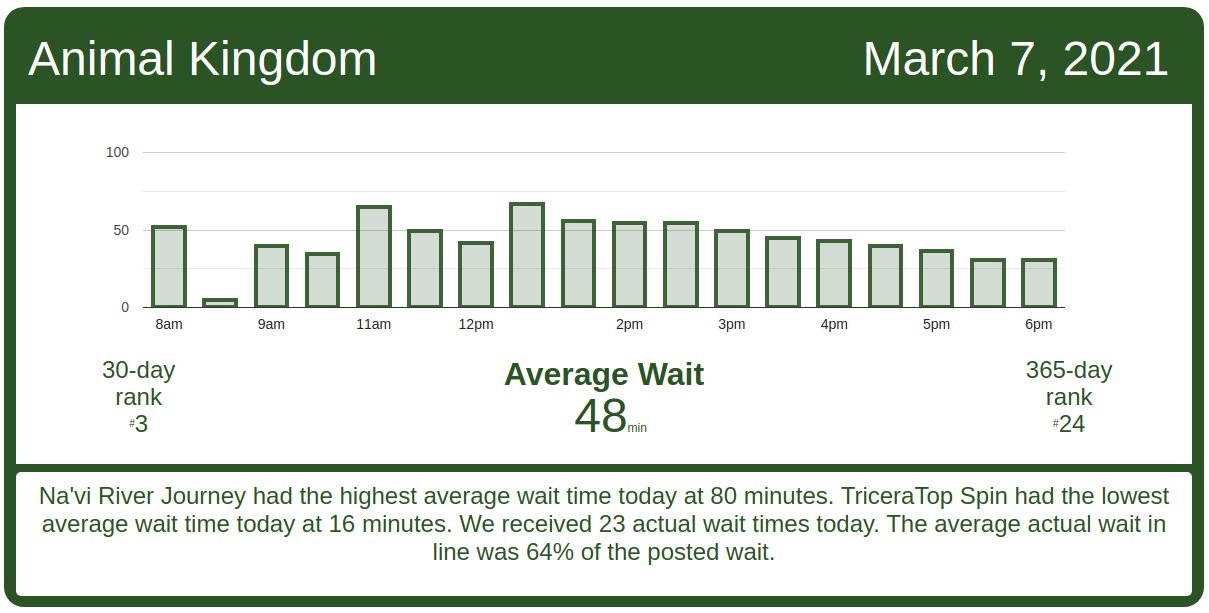
Animal Kingdom Wait Times

Kilimanjaro Safaris had an average wait time today of 42 minutes. Its 7-day average is 19 minutes, so today ranks #1 for this week. Its 30-day average is 27 minutes, so today ranks #2 for the past month. Its 365-day average is 22 minutes, so today ranks #13 for the past year. We received 6 actual wait times today, and the actual wait averaged 49% of the posted wait time.

Animal Kingdom wait times for Sunday, March 7, 2021
DINOSAUR
Average Posted Wait
62
7-Day Rank
#1
30-Day Rank
#1
365-Day Rank
#13
Expedition Everest – Legend of the Forbidden Mountain
Average Posted Wait
33
Actual Waits Were
62%
7-Day Rank
#1
30-Day Rank
#5
365-Day Rank
#68
Kilimanjaro Safaris
Average Posted Wait
42
Actual Waits Were
49%
7-Day Rank
#1
30-Day Rank
#2
365-Day Rank
#13
It’s Tough to Be a Bug!
Average Posted Wait
33
7-Day Rank
#1
30-Day Rank
#1
365-Day Rank
#5
TriceraTop Spin
Average Posted Wait
16
7-Day Rank
#1
30-Day Rank
#1
365-Day Rank
#1
Na’vi River Journey
Average Posted Wait
80
7-Day Rank
#1
30-Day Rank
#4
365-Day Rank
#14
Avatar Flight of Passage
Average Posted Wait
69
Actual Waits Were
72%
7-Day Rank
#1
30-Day Rank
#5
365-Day Rank
#51

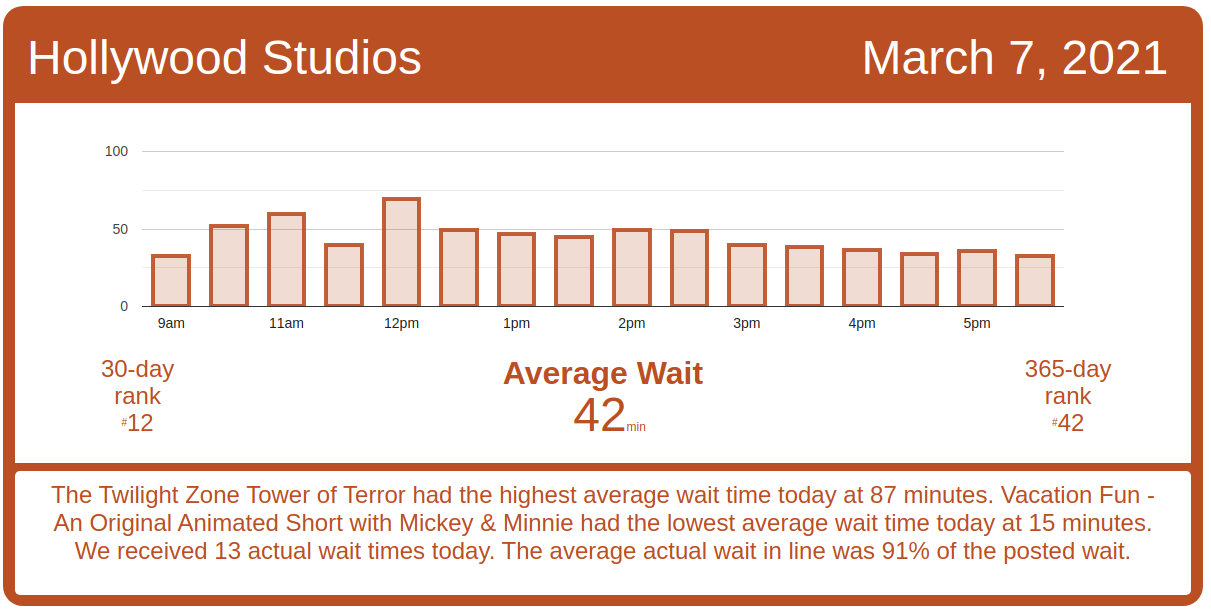
Hollywood Studios Wait Times

Slinky Dog Dash had an average wait time today of 70 minutes. Its 7-day average is 60 minutes, so today ranks #1 for this week. Its 30-day average is 64 minutes, so today ranks #7 for the past month. Its 365-day average is 59 minutes, so today ranks #57 for the past year.

Hollywood Studios wait times for Sunday, March 7, 2021

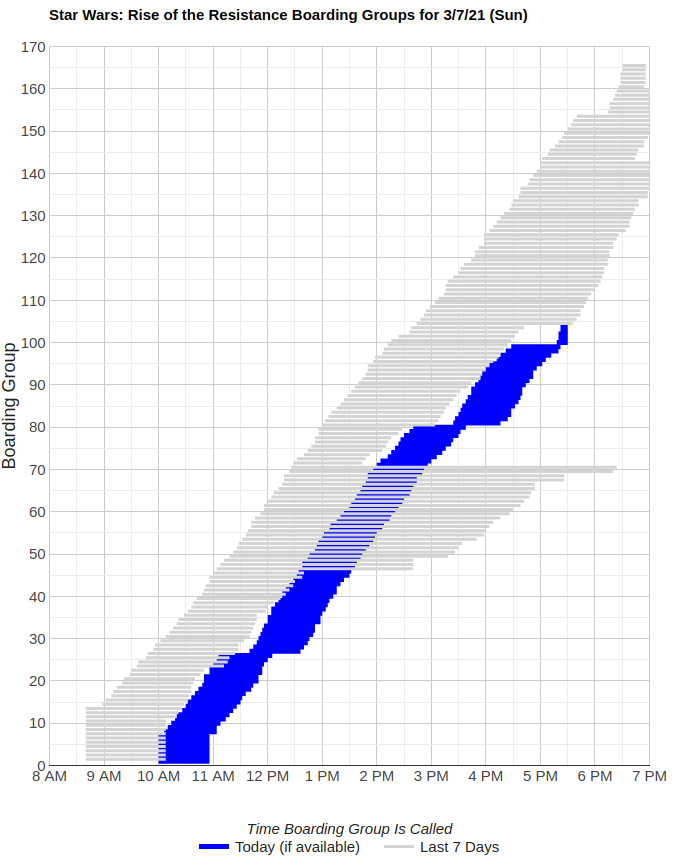
Rise of the Resistance had another rough day today. Rise of the Resistance normally starts calling boarding groups around 8:45 AM, but that was delayed 75 minutes today, until 10 AM.

Rise experienced its first delay of the day just after 11 AM at boarding group 27.  That delay lasted around 45 minutes.  Things ran smoothly until boarding group 81 at around 2:30 PM, when Rise of the Resistance stopped calling boarding groups for about 50 more minutes.  A third delay of around 50 minutes happened with boarding group 101 at 4:30 PM, and lasted until just before 5:30 PM.  At this point it looks like ROTR will be lucky to get to boarding group 130.

Even if FastPass+ came back tomorrow, Rise’s inability to run consistently means it would probably not offer FastPass+.  So expect boarding groups to continue for the foreseeable future.
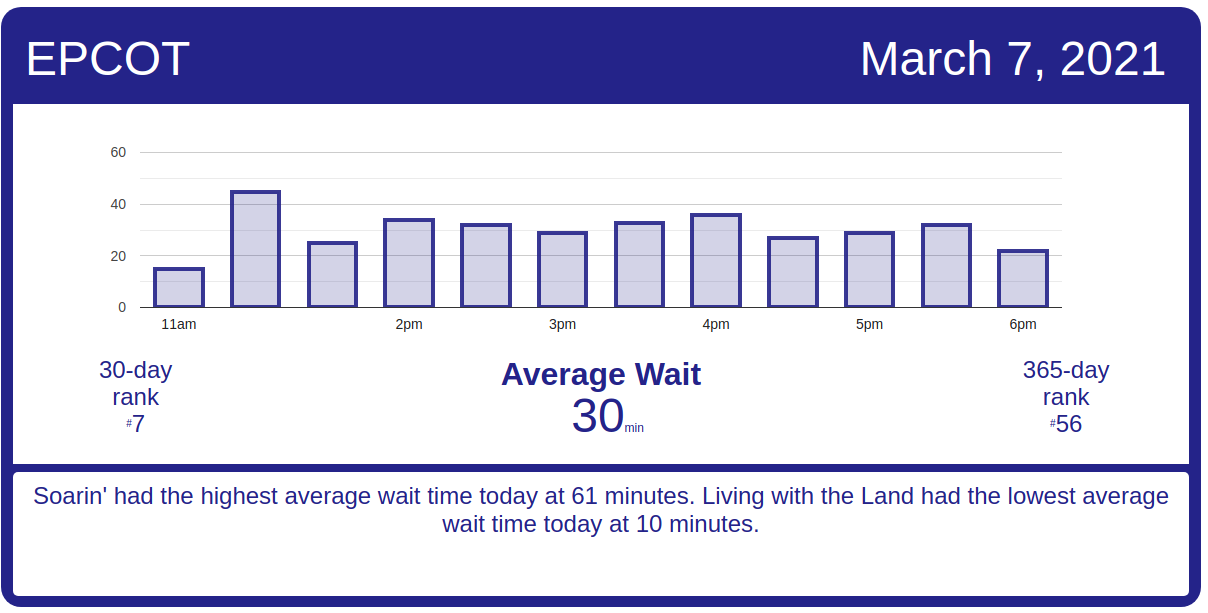
Rise of the Resistance boarding groups for Sunday, March 7, 2021
Muppet*Vision 3D
Average Posted Wait
29
7-Day Rank
#5
30-Day Rank
#21
365-Day Rank
#46
Rock ‘n’ Roller Coaster Starring Aerosmith
Average Posted Wait
43
7-Day Rank
#1
30-Day Rank
#12
365-Day Rank
#121
Star Tours: The Adventures Continue
Average Posted Wait
37
7-Day Rank
#1
30-Day Rank
#13
365-Day Rank
#35
The Twilight Zone Tower of Terror
Average Posted Wait
87
7-Day Rank
#1
30-Day Rank
#1
365-Day Rank
#1
Toy Story Mania!
Average Posted Wait
31
7-Day Rank
#5
30-Day Rank
#22
365-Day Rank
#70
Walt Disney Presents
Average Posted Wait
20
7-Day Rank
#1
30-Day Rank
#1
365-Day Rank
#1
Slinky Dog Dash
Average Posted Wait
70
7-Day Rank
#1
30-Day Rank
#7
365-Day Rank
#57
Alien Swirling Saucers
Average Posted Wait
31
7-Day Rank
#2
30-Day Rank
#11
365-Day Rank
#34
Mickey & Minnie’s Runaway Railway
Average Posted Wait
54
Actual Waits Were
95%
7-Day Rank
#1
30-Day Rank
#5
365-Day Rank
#119
Millennium Falcon: Smugglers Run
Average Posted Wait
63
7-Day Rank
#1
30-Day Rank
#12
365-Day Rank
#65

EPCOT Wait Times

Mission: SPACE Orange had an average wait time today of 43 minutes. Its 7-day average is 23 minutes, so today ranks #1 for this week. Its 30-day average is 30 minutes, so today ranks #2 for the past month. Its 365-day average is 27 minutes, so today ranks #25 for the past year.

EPCOT wait times for Sunday, March 7, 2021
Gran Fiesta Tour Starring The Three Caballeros
Average Posted Wait
11
7-Day Rank
#1
30-Day Rank
#10
365-Day Rank
#79
Journey Into Imagination With Figment
Average Posted Wait
21
7-Day Rank
#1
30-Day Rank
#5
365-Day Rank
#42
Living with the Land
Average Posted Wait
10
7-Day Rank
#1
30-Day Rank
#6
365-Day Rank
#142
Mission: SPACE Orange
Average Posted Wait
43
7-Day Rank
#1
30-Day Rank
#2
365-Day Rank
#25
Soarin’
Average Posted Wait
61
7-Day Rank
#1
30-Day Rank
#3
365-Day Rank
#15
Spaceship Earth
Average Posted Wait
30
7-Day Rank
#1
30-Day Rank
#6
365-Day Rank
#28
Test Track
Average Posted Wait
57
7-Day Rank
#1
30-Day Rank
#10
365-Day Rank
#94
The Seas with Nemo & Friends
Average Posted Wait
19
7-Day Rank
#1
30-Day Rank
#1
365-Day Rank
#19
Frozen Ever After
Average Posted Wait
44
7-Day Rank
#1
30-Day Rank
#4
365-Day Rank
#107

The post An Abnormal Day for Data – Disney World Wait Times for Sunday, March 7, 2021 appeared first on TouringPlans.com Blog.