Crowds Return – Disney World wait times for Monday, March 15, 2021

Crowds have returned to Walt Disney World this week, with average posted wait times in the top 10 of the past month for the Magic Kingdom, Animal Kingdom, and EPCOT.

We counted 474 of 500 guests (95%) wearing masks according to Disney’s mask guidelines.  And we’ve got 257 actual wait times so far from our fabulous Lines community. Let’s do the rest of the numbers!

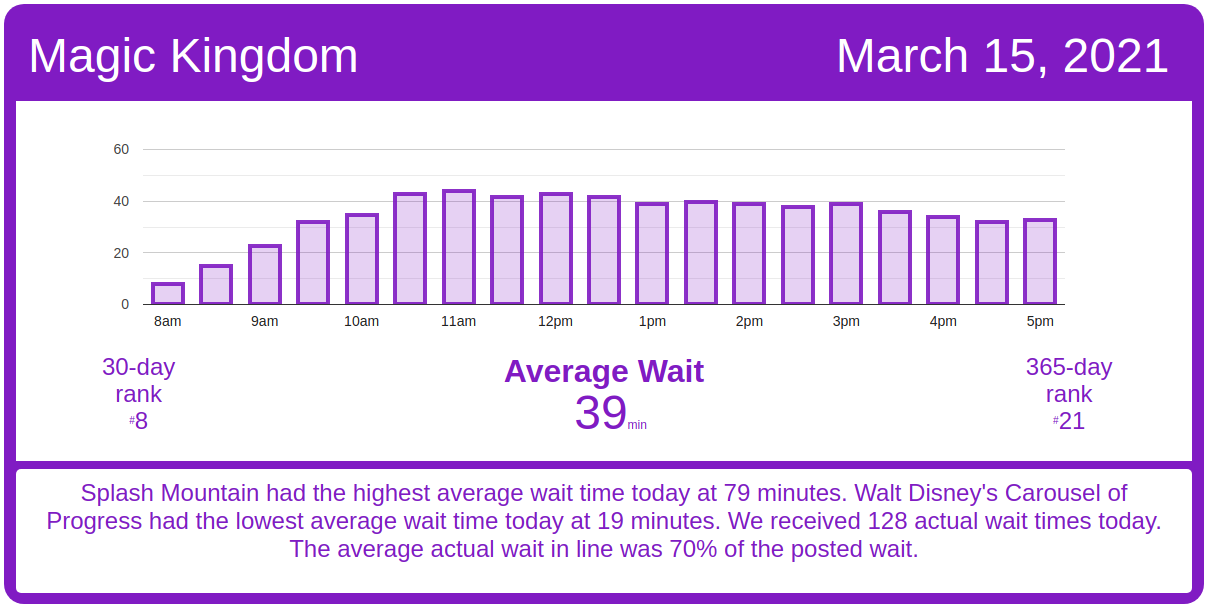
Magic Kingdom Wait Times

The Many Adventures of Winnie the Pooh had an average wait time today of 29 minutes. Its 7-day average is 30 minutes, so today ranks #3 for this week. Its 30-day average is 30 minutes, so today ranks #20 for the past month.  We received 4 actual wait times today, and the actual wait averaged 73% of the posted wait time.

Magic Kingdom wait times for Monday, March 15, 2021
Astro Orbiter
Average Posted Wait
42
7-Day Rank
#3
30-Day Rank
#13
365-Day Rank
#34
Big Thunder Mountain Railroad
Average Posted Wait
40
Actual Waits Were
24%
7-Day Rank
#3
30-Day Rank
#23
365-Day Rank
#143
Buzz Lightyear’s Space Ranger Spin
Average Posted Wait
40
Actual Waits Were
86%
7-Day Rank
#4
30-Day Rank
#19
365-Day Rank
#51
Prince Charming Regal Carrousel
Average Posted Wait
36
7-Day Rank
#1
30-Day Rank
#1
365-Day Rank
#1
Dumbo the Flying Elephant
Average Posted Wait
22
Actual Waits Were
97%
7-Day Rank
#3
30-Day Rank
#15
365-Day Rank
#32
“it’s a small world”
Average Posted Wait
46
7-Day Rank
#3
30-Day Rank
#16
365-Day Rank
#33
Jungle Cruise
Average Posted Wait
55
Actual Waits Were
89%
7-Day Rank
#1
30-Day Rank
#1
365-Day Rank
#8
Mad Tea Party
Average Posted Wait
22
7-Day Rank
#1
30-Day Rank
#5
365-Day Rank
#12
Mickey’s PhilharMagic
Average Posted Wait
32
7-Day Rank
#1
30-Day Rank
#6
365-Day Rank
#24
Peter Pan’s Flight
Average Posted Wait
45
Actual Waits Were
93%
7-Day Rank
#4
30-Day Rank
#12
365-Day Rank
#30
Pirates of the Caribbean
Average Posted Wait
59
Actual Waits Were
77%
7-Day Rank
#2
30-Day Rank
#12
365-Day Rank
#24
Tom Sawyer Island
Average Posted Wait
30
7-Day Rank
#1
30-Day Rank
#1
365-Day Rank
#1
Space Mountain
Average Posted Wait
63
Actual Waits Were
85%
7-Day Rank
#1
30-Day Rank
#5
365-Day Rank
#20
Splash Mountain
Average Posted Wait
79
Actual Waits Were
78%
7-Day Rank
#4
30-Day Rank
#8
365-Day Rank
#20
The Barnstormer
Average Posted Wait
23
Actual Waits Were
55%
7-Day Rank
#1
30-Day Rank
#18
365-Day Rank
#79
The Haunted Mansion
Average Posted Wait
30
Actual Waits Were
55%
7-Day Rank
#3
30-Day Rank
#15
365-Day Rank
#97
The Magic Carpets of Aladdin
Average Posted Wait
21
7-Day Rank
#1
30-Day Rank
#9
365-Day Rank
#13
The Many Adventures of Winnie the Pooh
Average Posted Wait
29
Actual Waits Were
73%
7-Day Rank
#3
30-Day Rank
#20
365-Day Rank
#61
Tomorrowland Speedway
Average Posted Wait
21
Actual Waits Were
72%
7-Day Rank
#2
30-Day Rank
#13
365-Day Rank
#49
Walt Disney’s Carousel of Progress
Average Posted Wait
19
Actual Waits Were
63%
7-Day Rank
#1
30-Day Rank
#1
365-Day Rank
#1
Seven Dwarfs Mine Train
Average Posted Wait
67
Actual Waits Were
92%
7-Day Rank
#1
30-Day Rank
#13
365-Day Rank
#71
Under the Sea ~ Journey of the Little Mermaid
Average Posted Wait
25
Actual Waits Were
48%
7-Day Rank
#1
30-Day Rank
#17
365-Day Rank
#82

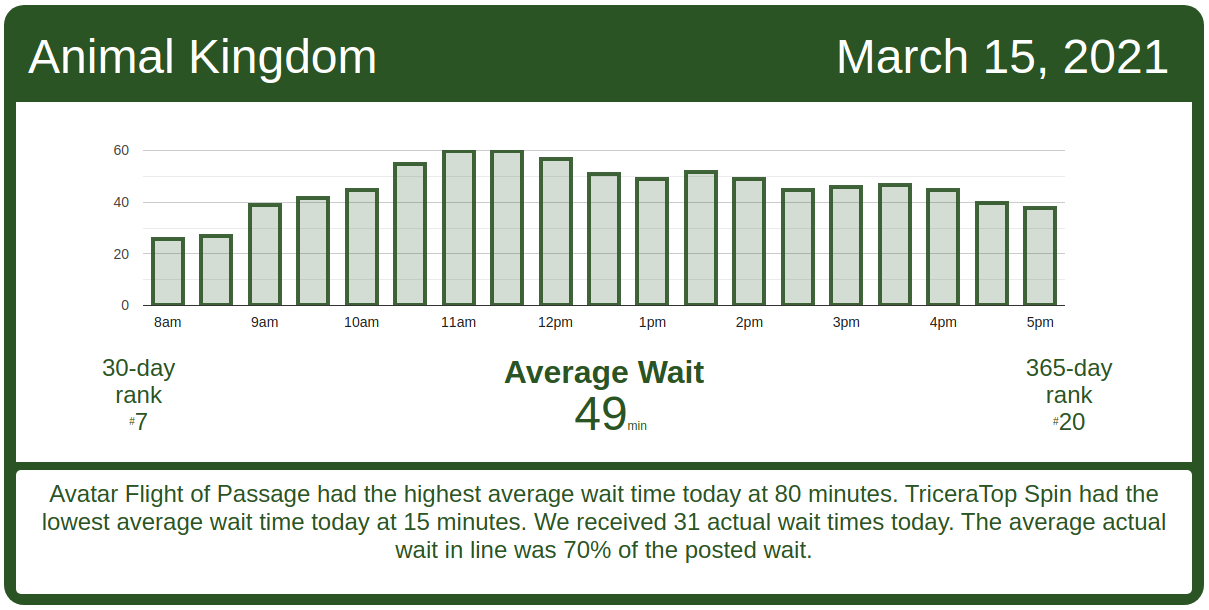
Animal Kingdom Wait Times

Na’vi River Journey had an average wait time today of 77 minutes. Its 7-day average is 85 minutes, so today ranks #4 for this week. Its 30-day average is 75 minutes, so today ranks #14 for the past month. We received 4 actual wait times today, and the actual wait averaged 74% of the posted wait time.

Animal Kingdom wait times for Monday, March 15, 2021
DINOSAUR
Average Posted Wait
62
7-Day Rank
#1
30-Day Rank
#2
365-Day Rank
#13
Expedition Everest – Legend of the Forbidden Mountain
Average Posted Wait
36
Actual Waits Were
101%
7-Day Rank
#1
30-Day Rank
#4
365-Day Rank
#47
Kilimanjaro Safaris
Average Posted Wait
42
Actual Waits Were
56%
7-Day Rank
#1
30-Day Rank
#3
365-Day Rank
#7
It’s Tough to Be a Bug!
Average Posted Wait
36
7-Day Rank
#1
30-Day Rank
#1
365-Day Rank
#1
TriceraTop Spin
Average Posted Wait
15
7-Day Rank
#2
30-Day Rank
#4
365-Day Rank
#5
Na’vi River Journey
Average Posted Wait
77
Actual Waits Were
74%
7-Day Rank
#4
30-Day Rank
#14
365-Day Rank
#21
Avatar Flight of Passage
Average Posted Wait
80
Actual Waits Were
72%
7-Day Rank
#2
30-Day Rank
#5
365-Day Rank
#29

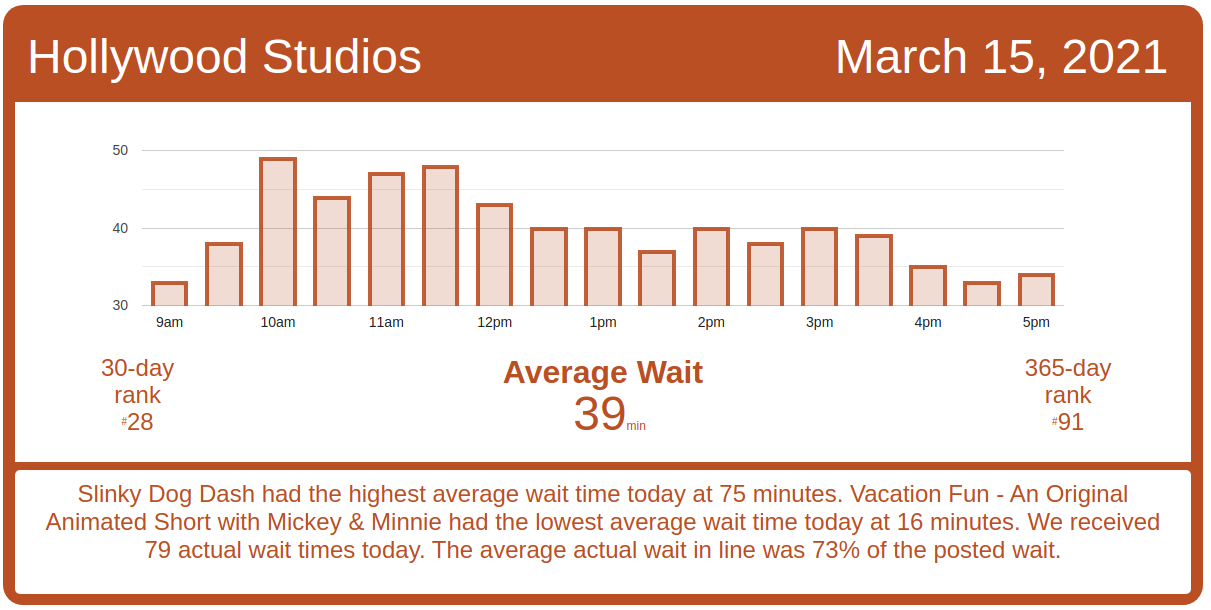
Hollywood Studios Wait Times

Rock ‘n’ Roller Coaster Starring Aerosmith had an average wait time today of 40 minutes. Its 7-day average is 50 minutes, so today ranks #6 for this week. Its 30-day average is 45 minutes, so today ranks #21 for the past month. We received 5 actual wait times today, and the actual wait averaged 66% of the posted wait time.

Hollywood Studios wait times for Monday, March 15, 2021

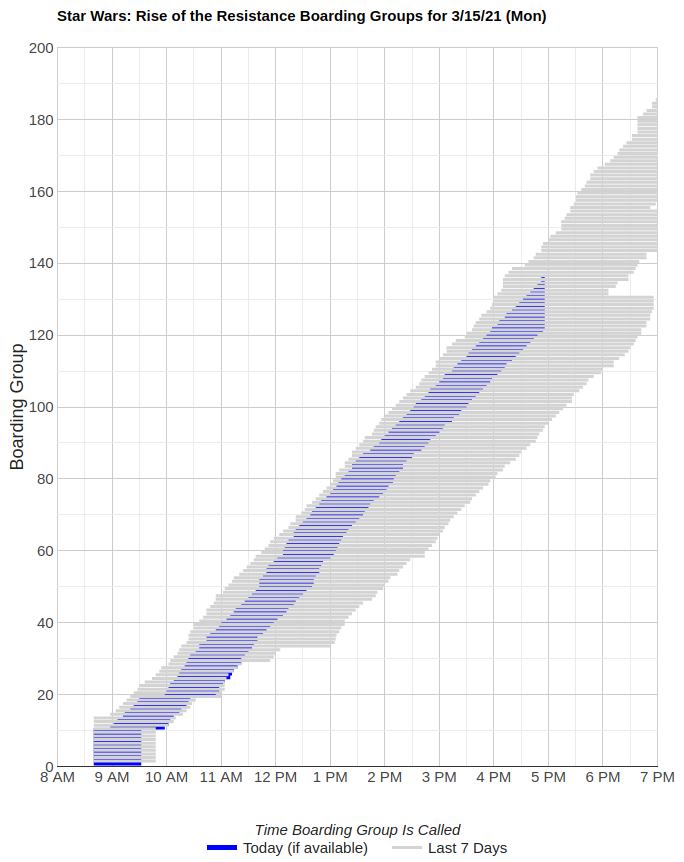
Rise of the Resistance has had a decent day of operations.  Rise of the Resistance began calling boarding groups 1 through 10 around 8:45 AM. It looks like there was a delay soon after that, though, around boarding group 29.  No boarding groups were called between 9:30 AM and 10 AM, which put Rise of the Resistance a bit off its best pace for the past week.  Things have been running well since then, though, and it looks like Rise should get to boarding group 160 before the end of the day.
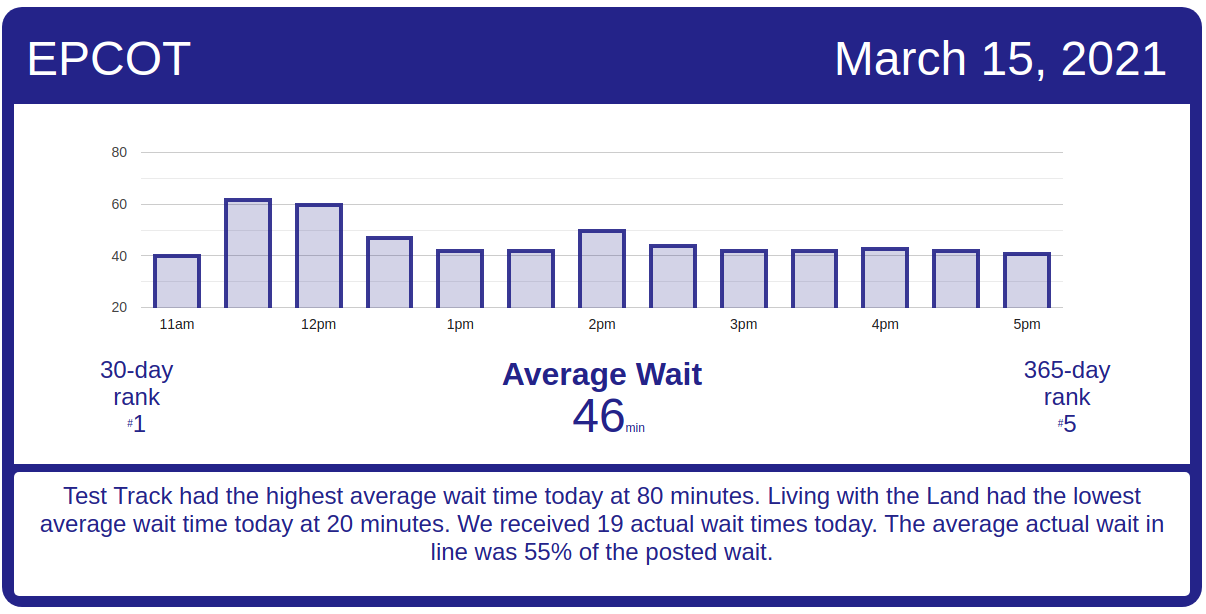
Rise of the Resistance boarding group times for Monday, March 15, 2021
Muppet*Vision 3D
Average Posted Wait
31
7-Day Rank
#3
30-Day Rank
#14
365-Day Rank
#35
Rock ‘n’ Roller Coaster Starring Aerosmith
Average Posted Wait
40
Actual Waits Were
66%
7-Day Rank
#6
30-Day Rank
#21
365-Day Rank
#133
Star Tours: The Adventures Continue
Average Posted Wait
40
Actual Waits Were
60%
7-Day Rank
#4
30-Day Rank
#9
365-Day Rank
#20
The Twilight Zone Tower of Terror
Average Posted Wait
53
Actual Waits Were
87%
7-Day Rank
#6
30-Day Rank
#28
365-Day Rank
#94
Toy Story Mania!
Average Posted Wait
33
Actual Waits Were
69%
7-Day Rank
#5
30-Day Rank
#19
365-Day Rank
#46
Walt Disney Presents
Average Posted Wait
20
7-Day Rank
#1
30-Day Rank
#1
365-Day Rank
#1
Slinky Dog Dash
Average Posted Wait
75
Actual Waits Were
75%
7-Day Rank
#2
30-Day Rank
#4
365-Day Rank
#20
Alien Swirling Saucers
Average Posted Wait
29
Actual Waits Were
62%
7-Day Rank
#4
30-Day Rank
#20
365-Day Rank
#56
Mickey & Minnie’s Runaway Railway
Average Posted Wait
42
Actual Waits Were
79%
7-Day Rank
#3
30-Day Rank
#26
365-Day Rank
#203
Millennium Falcon: Smugglers Run
Average Posted Wait
57
Actual Waits Were
83%
7-Day Rank
#6
30-Day Rank
#26
365-Day Rank
#101

EPCOT Wait Times

Spaceship Earth had an average wait time today of 44 minutes. Its 7-day average is 28 minutes, so today ranks #1 for this week. Its 30-day average is 24 minutes, so today ranks #1 for the past month. Its 365-day average is 17 minutes, so today ranks #2 for the past year. We received 6 actual wait times today, and the actual wait averaged 35% of the posted wait time.

EPCOT wait times for Monday, March 15, 2021
Gran Fiesta Tour Starring The Three Caballeros
Average Posted Wait
23
7-Day Rank
#1
30-Day Rank
#1
365-Day Rank
#1
Journey Into Imagination With Figment
Average Posted Wait
29
7-Day Rank
#1
30-Day Rank
#1
365-Day Rank
#14
Living with the Land
Average Posted Wait
20
7-Day Rank
#1
30-Day Rank
#1
365-Day Rank
#3
Mission: SPACE Orange
Average Posted Wait
53
7-Day Rank
#1
30-Day Rank
#1
365-Day Rank
#12
Soarin’
Average Posted Wait
78
7-Day Rank
#1
30-Day Rank
#1
365-Day Rank
#3
Spaceship Earth
Average Posted Wait
44
Actual Waits Were
35%
7-Day Rank
#1
30-Day Rank
#1
365-Day Rank
#2
Test Track
Average Posted Wait
80
7-Day Rank
#1
30-Day Rank
#4
365-Day Rank
#21
The Seas with Nemo & Friends
Average Posted Wait
22
7-Day Rank
#1
30-Day Rank
#1
365-Day Rank
#7
Mission: SPACE Green
Average Posted Wait
60
7-Day Rank
#1
30-Day Rank
#1
365-Day Rank
#3
Frozen Ever After
Average Posted Wait
67
7-Day Rank
#1
30-Day Rank
#1
365-Day Rank
#46

The post Crowds Return – Disney World wait times for Monday, March 15, 2021 appeared first on TouringPlans.com Blog.