Great Day to Be in The Parks! – Disney World Wait Times for Sunday, April 4, 2021

Cooler weather and moderate crowds made today a great day to be in Walt Disney World.  Average wait times at all parks except EPCOT were in the lower half of waits for the past month.  And compared to Easter 2019, today’s wait times at the Magic Kingdom were around 15% lower.  Easter was much later in 2019 – on April 21 – and that made actual crowd levels a 3 on our 1-to-10 scale. Today was lower than that.

We’ve already got 261 actual wait times today from our fabulous Lines community. Let’s do the rest of the numbers!

Magic Kingdom Wait Times

Seven Dwarfs Mine Train had an average wait time today of 64 minutes. Its 7-day average is 66 minutes, so today ranks #3 for this week. Its 30-day average is 63 minutes, so today ranks #13 for the past month. Its 365-day average is 57 minutes, so today ranks #92 for the past year. We received 5 actual wait times today, and the actual wait averaged 73% of the posted wait time.

Magic Kingdom wait times for Sunday, April 4, 2021
Astro Orbiter
Average Posted Wait
37
Actual Waits Were
87%
7-Day Rank
#4
30-Day Rank
#22
365-Day Rank
#93
Big Thunder Mountain Railroad
Average Posted Wait
43
Actual Waits Were
32%
7-Day Rank
#3
30-Day Rank
#14
365-Day Rank
#137
Buzz Lightyear’s Space Ranger Spin
Average Posted Wait
37
Actual Waits Were
97%
7-Day Rank
#6
30-Day Rank
#27
365-Day Rank
#101
Prince Charming Regal Carrousel
Average Posted Wait
26
7-Day Rank
#1
30-Day Rank
#1
365-Day Rank
#1
Country Bear Jamboree
Average Posted Wait
20
7-Day Rank
#1
30-Day Rank
#1
365-Day Rank
#1
Dumbo the Flying Elephant
Average Posted Wait
20
Actual Waits Were
62%
7-Day Rank
#4
30-Day Rank
#18
365-Day Rank
#54
“it’s a small world”
Average Posted Wait
40
Actual Waits Were
86%
7-Day Rank
#6
30-Day Rank
#27
365-Day Rank
#108
Jungle Cruise
Average Posted Wait
43
Actual Waits Were
83%
7-Day Rank
#5
30-Day Rank
#25
365-Day Rank
#106
Mad Tea Party
Average Posted Wait
15
Actual Waits Were
74%
7-Day Rank
#6
30-Day Rank
#28
365-Day Rank
#93
Mickey’s PhilharMagic
Average Posted Wait
29
7-Day Rank
#6
30-Day Rank
#26
365-Day Rank
#71
Peter Pan’s Flight
Average Posted Wait
39
Actual Waits Were
95%
7-Day Rank
#4
30-Day Rank
#26
365-Day Rank
#87
Pirates of the Caribbean
Average Posted Wait
48
Actual Waits Were
86%
7-Day Rank
#6
30-Day Rank
#27
365-Day Rank
#118
Space Mountain
Average Posted Wait
49
Actual Waits Were
81%
7-Day Rank
#6
30-Day Rank
#24
365-Day Rank
#82
Splash Mountain
Average Posted Wait
83
Actual Waits Were
97%
7-Day Rank
#1
30-Day Rank
#7
365-Day Rank
#17
The Barnstormer
Average Posted Wait
16
Actual Waits Were
90%
7-Day Rank
#6
30-Day Rank
#25
365-Day Rank
#154
The Haunted Mansion
Average Posted Wait
33
Actual Waits Were
62%
7-Day Rank
#1
30-Day Rank
#4
365-Day Rank
#68
The Magic Carpets of Aladdin
Average Posted Wait
18
Actual Waits Were
62%
7-Day Rank
#5
30-Day Rank
#18
365-Day Rank
#46
The Many Adventures of Winnie the Pooh
Average Posted Wait
24
Actual Waits Were
77%
7-Day Rank
#7
30-Day Rank
#27
365-Day Rank
#131
Tomorrowland Speedway
Average Posted Wait
14
Actual Waits Were
76%
7-Day Rank
#6
30-Day Rank
#28
365-Day Rank
#149
Seven Dwarfs Mine Train
Average Posted Wait
64
Actual Waits Were
73%
7-Day Rank
#3
30-Day Rank
#13
365-Day Rank
#92
Under the Sea ~ Journey of the Little Mermaid
Average Posted Wait
22
Actual Waits Were
51%
7-Day Rank
#4
30-Day Rank
#22
365-Day Rank
#134

Animal Kingdom Wait Times

Expedition Everest had an average wait time today of 25 minutes. Its 7-day average is 26 minutes, so today ranks #5 for this week. Its 30-day average is 26 minutes, so today ranks #17 for the past month. Its 365-day average is 25 minutes, so today ranks #116 for the past year. We received 5 actual wait times today, and the actual wait averaged 84% of the posted wait time.

Animal Kingdom wait times for Sunday, April 4, 2021
DINOSAUR
Average Posted Wait
42
7-Day Rank
#6
30-Day Rank
#28
365-Day Rank
#90
Expedition Everest – Legend of the Forbidden Mountain
Average Posted Wait
25
Actual Waits Were
84%
7-Day Rank
#5
30-Day Rank
#17
365-Day Rank
#116
Kali River Rapids
Average Posted Wait
39
7-Day Rank
#1
30-Day Rank
#1
365-Day Rank
#11
Kilimanjaro Safaris
Average Posted Wait
31
Actual Waits Were
51%
7-Day Rank
#4
30-Day Rank
#22
365-Day Rank
#60
It’s Tough to Be a Bug!
Average Posted Wait
29
7-Day Rank
#5
30-Day Rank
#21
365-Day Rank
#39
TriceraTop Spin
Average Posted Wait
10
7-Day Rank
#3
30-Day Rank
#21
365-Day Rank
#33
Na’vi River Journey
Average Posted Wait
39
Actual Waits Were
70%
7-Day Rank
#6
30-Day Rank
#28
365-Day Rank
#168
Avatar Flight of Passage
Average Posted Wait
71
7-Day Rank
#5
30-Day Rank
#17
365-Day Rank
#58

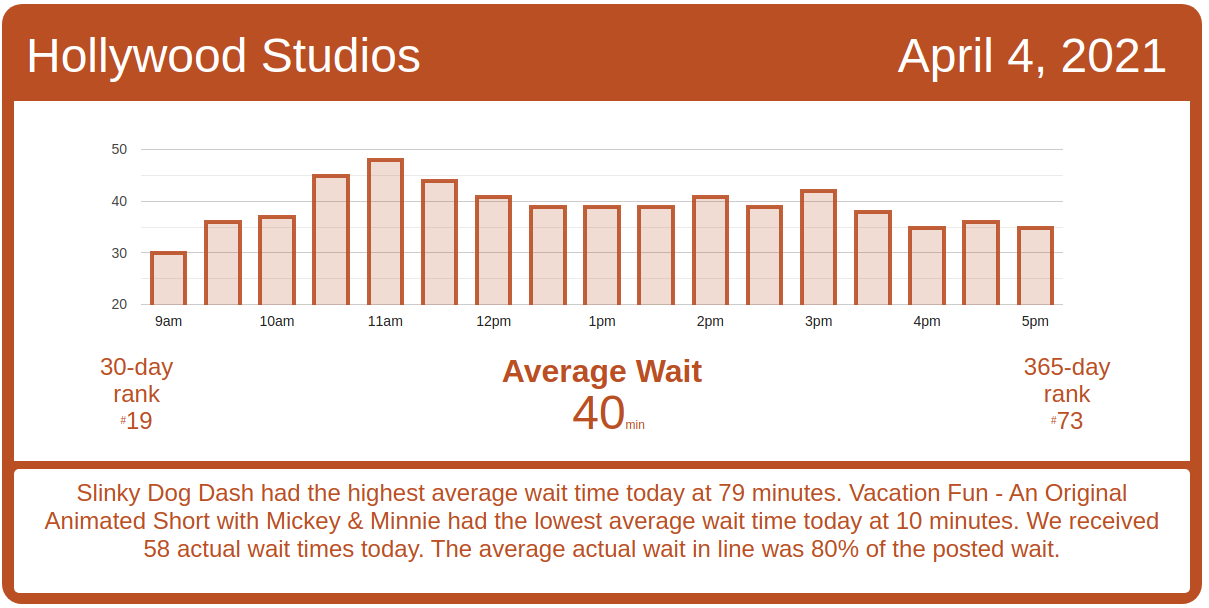
Hollywood Studios Wait Times

Millennium Falcon: Smugglers Run had an average wait time today of 63 minutes. Its 7-day average is 63 minutes, so today ranks #3 for this week. Its 30-day average is 62 minutes, so today ranks #13 for the past month. Its 365-day average is 53 minutes, so today ranks #67 for the past year. We received 7 actual wait times today, and the actual wait averaged 90% of the posted wait time.

Hollywood Studios wait times for Sunday, April 4, 2021

Rise of the Resistance is running like a top again today! Rise began calling boarding groups at 8:30 AM today, and has run with no significant delays in calling boarding groups.  ROTR has called just under 1460 boarding groups as I write this, and is on pace to call over 180 boarding groups today.

Rise of the Resistance boarding groups for Sunday, April 4, 2021
Muppet*Vision 3D
Average Posted Wait
30
7-Day Rank
#7
30-Day Rank
#26
365-Day Rank
#66
Rock ‘n’ Roller Coaster Starring Aerosmith
Average Posted Wait
51
Actual Waits Were
77%
7-Day Rank
#1
30-Day Rank
#3
365-Day Rank
#55
Star Tours: The Adventures Continue
Average Posted Wait
36
Actual Waits Were
73%
7-Day Rank
#3
30-Day Rank
#12
365-Day Rank
#50
The Twilight Zone Tower of Terror
Average Posted Wait
67
Actual Waits Were
103%
7-Day Rank
#1
30-Day Rank
#11
365-Day Rank
#38
Toy Story Mania!
Average Posted Wait
33
Actual Waits Were
79%
7-Day Rank
#4
30-Day Rank
#21
365-Day Rank
#63
Slinky Dog Dash
Average Posted Wait
79
Actual Waits Were
58%
7-Day Rank
#3
30-Day Rank
#6
365-Day Rank
#16
Alien Swirling Saucers
Average Posted Wait
30
7-Day Rank
#4
30-Day Rank
#19
365-Day Rank
#62
Mickey & Minnie’s Runaway Railway
Average Posted Wait
40
Actual Waits Were
81%
7-Day Rank
#2
30-Day Rank
#21
365-Day Rank
#238
Millennium Falcon: Smugglers Run
Average Posted Wait
63
Actual Waits Were
90%
7-Day Rank
#3
30-Day Rank
#13
365-Day Rank
#67
Lightning McQueen’s Racing Academy
Average Posted Wait
31
7-Day Rank
#4
30-Day Rank
#12
365-Day Rank
#46

EPCOT Wait Times

Test Track had an average wait time today of 67 minutes. Its 7-day average is 76 minutes, so today ranks #6 for this week. Its 30-day average is 68 minutes, so today ranks #19 for the past month. Its 365-day average is 55 minutes, so today ranks #73 for the past year. We received 4 actual wait times today, and the actual wait averaged 78% of the posted wait time.

EPCOT wait times for Sunday, April 4, 2021
Gran Fiesta Tour Starring The Three Caballeros
Average Posted Wait
18
7-Day Rank
#1
30-Day Rank
#2
365-Day Rank
#6
Journey Into Imagination With Figment
Average Posted Wait
23
7-Day Rank
#1
30-Day Rank
#1
365-Day Rank
#31
Living with the Land
Average Posted Wait
14
7-Day Rank
#1
30-Day Rank
#4
365-Day Rank
#48
Mission: SPACE Orange
Average Posted Wait
52
7-Day Rank
#5
30-Day Rank
#11
365-Day Rank
#23
Soarin’
Average Posted Wait
65
7-Day Rank
#3
30-Day Rank
#7
365-Day Rank
#16
Spaceship Earth
Average Posted Wait
32
7-Day Rank
#4
30-Day Rank
#7
365-Day Rank
#22
Test Track
Average Posted Wait
67
Actual Waits Were
78%
7-Day Rank
#6
30-Day Rank
#19
365-Day Rank
#73
The Seas with Nemo & Friends
Average Posted Wait
20
7-Day Rank
#1
30-Day Rank
#3
365-Day Rank
#13
Frozen Ever After
Average Posted Wait
54
7-Day Rank
#3
30-Day Rank
#5
365-Day Rank
#81

The post Great Day to Be in The Parks! – Disney World Wait Times for Sunday, April 4, 2021 appeared first on TouringPlans.com Blog.