Crowds Flock to MK, EPCOT | Disney World Wait Times for Monday, April 5, 2021

Today’s posted wait times seem to indicate more folks at the Magic Kingdom and EPCOT than at the Studios or Animal Kingdom.  Average waits at the Magic Kingdom were 10th highest for the past month, while EPCOT’s crowds were 6th highest.

We’ve received 240 actual wait times so far today from our fabulous Lines community.  And we’ve counted 491 of 500 guests (98%) in EPCOT wearing masks according to Disney’s mask guidelines.  Let’s do the rest of the numbers!

Magic Kingdom Wait Times

Splash Mountain had an average wait time today of 82 minutes. Its 7-day average is 76 minutes, so today ranks #2 for this week. Its 30-day average is 75 minutes, so today ranks #10 for the past month. Its 365-day average is 52 minutes, so today ranks #23 for the past year. We received 6 actual wait times today, and the actual wait averaged 55% of the posted wait time.

Magic Kingdom wait times for Monday, April 5, 2021
Astro Orbiter
Average Posted Wait
39
7-Day Rank
#4
30-Day Rank
#20
365-Day Rank
#75
Big Thunder Mountain Railroad
Average Posted Wait
38
Actual Waits Were
30%
7-Day Rank
#5
30-Day Rank
#21
365-Day Rank
#170
Buzz Lightyear’s Space Ranger Spin
Average Posted Wait
40
Actual Waits Were
73%
7-Day Rank
#4
30-Day Rank
#20
365-Day Rank
#65
Prince Charming Regal Carrousel
Average Posted Wait
27
7-Day Rank
#1
30-Day Rank
#1
365-Day Rank
#1
Country Bear Jamboree
Average Posted Wait
20
7-Day Rank
#1
30-Day Rank
#1
365-Day Rank
#1
Dumbo the Flying Elephant
Average Posted Wait
20
7-Day Rank
#4
30-Day Rank
#20
365-Day Rank
#58
“it’s a small world”
Average Posted Wait
42
7-Day Rank
#5
30-Day Rank
#25
365-Day Rank
#91
Jungle Cruise
Average Posted Wait
52
Actual Waits Were
83%
7-Day Rank
#1
30-Day Rank
#9
365-Day Rank
#19
Mad Tea Party
Average Posted Wait
17
Actual Waits Were
60%
7-Day Rank
#5
30-Day Rank
#24
365-Day Rank
#61
Mickey’s PhilharMagic
Average Posted Wait
30
7-Day Rank
#4
30-Day Rank
#21
365-Day Rank
#56
Peter Pan’s Flight
Average Posted Wait
43
Actual Waits Were
109%
7-Day Rank
#2
30-Day Rank
#16
365-Day Rank
#52
Pirates of the Caribbean
Average Posted Wait
57
Actual Waits Were
66%
7-Day Rank
#2
30-Day Rank
#12
365-Day Rank
#44
Tom Sawyer Island
Average Posted Wait
42
7-Day Rank
#1
30-Day Rank
#1
365-Day Rank
#1
Space Mountain
Average Posted Wait
53
Actual Waits Were
80%
7-Day Rank
#3
30-Day Rank
#17
365-Day Rank
#61
Splash Mountain
Average Posted Wait
82
Actual Waits Were
55%
7-Day Rank
#2
30-Day Rank
#10
365-Day Rank
#23
The Barnstormer
Average Posted Wait
22
Actual Waits Were
107%
7-Day Rank
#2
30-Day Rank
#14
365-Day Rank
#99
The Haunted Mansion
Average Posted Wait
26
Actual Waits Were
48%
7-Day Rank
#4
30-Day Rank
#23
365-Day Rank
#153
The Magic Carpets of Aladdin
Average Posted Wait
20
7-Day Rank
#4
30-Day Rank
#12
365-Day Rank
#28
The Many Adventures of Winnie the Pooh
Average Posted Wait
26
Actual Waits Were
75%
7-Day Rank
#4
30-Day Rank
#24
365-Day Rank
#106
Tomorrowland Speedway
Average Posted Wait
19
7-Day Rank
#5
30-Day Rank
#17
365-Day Rank
#79
Seven Dwarfs Mine Train
Average Posted Wait
64
Actual Waits Were
75%
7-Day Rank
#3
30-Day Rank
#14
365-Day Rank
#93
Under the Sea ~ Journey of the Little Mermaid
Average Posted Wait
24
Actual Waits Were
38%
7-Day Rank
#3
30-Day Rank
#19
365-Day Rank
#118

Animal Kingdom Wait Times

Na’vi River Journey had an average wait time today of 37 minutes. Its 7-day average is 43 minutes, so today ranks #6 for this week. Its 30-day average is 62 minutes, so today ranks #28 for the past month. Its 365-day average is 46 minutes, so today ranks #184 for the past year. We received 4 actual wait times today, and the actual wait averaged 61% of the posted wait time.

Animal Kingdom wait times for Monday, April 5, 2021
DINOSAUR
Average Posted Wait
49
7-Day Rank
#4
30-Day Rank
#20
365-Day Rank
#55
Expedition Everest – Legend of the Forbidden Mountain
Average Posted Wait
26
Actual Waits Were
73%
7-Day Rank
#3
30-Day Rank
#16
365-Day Rank
#110
Kali River Rapids
Average Posted Wait
43
7-Day Rank
#1
30-Day Rank
#1
365-Day Rank
#8
Kilimanjaro Safaris
Average Posted Wait
32
Actual Waits Were
60%
7-Day Rank
#3
30-Day Rank
#20
365-Day Rank
#53
It’s Tough to Be a Bug!
Average Posted Wait
26
7-Day Rank
#6
30-Day Rank
#25
365-Day Rank
#50
TriceraTop Spin
Average Posted Wait
11
7-Day Rank
#1
30-Day Rank
#17
365-Day Rank
#24
Na’vi River Journey
Average Posted Wait
37
Actual Waits Were
61%
7-Day Rank
#6
30-Day Rank
#28
365-Day Rank
#184
Avatar Flight of Passage
Average Posted Wait
77
7-Day Rank
#2
30-Day Rank
#11
365-Day Rank
#42

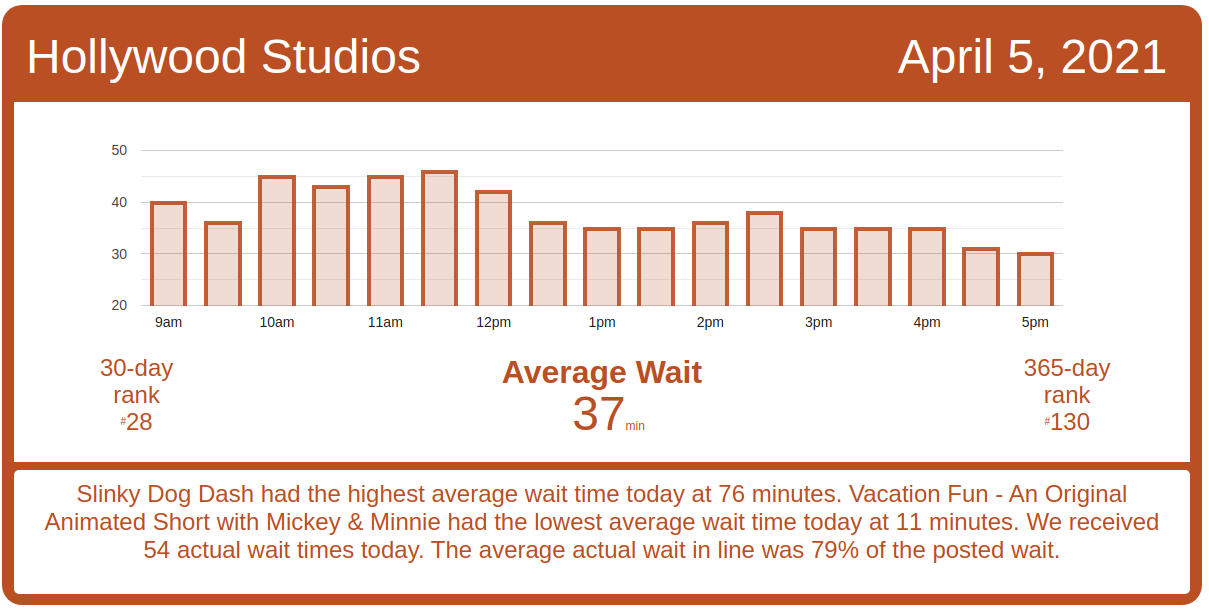
Hollywood Studios Wait Times

Slinky Dog Dash had an average wait time today of 76 minutes. Its 7-day average is 76 minutes, so today ranks #3 for this week. Its 30-day average is 72 minutes, so today ranks #11 for the past month. Its 365-day average is 59 minutes, so today ranks #28 for the past year. We received 9 actual wait times today, and the actual wait averaged 76% of the posted wait time.

Hollywood Studios wait times for Monday, April 5, 2021

Rise of the Resistance is on a bit of a success streak, with at least three straight days of solid performance in a row.  Rise of the Resistance began calling boarding groups today around 8:45 a.m. and has run continuously since then.  As I write this, ROTR has called over 140 boarding groups, and should easily get to 160 today.

Rise of the Resistance boarding groups for Monday, April 5, 2021
Muppet*Vision 3D
Average Posted Wait
30
7-Day Rank
#6
30-Day Rank
#26
365-Day Rank
#64
Rock ‘n’ Roller Coaster Starring Aerosmith
Average Posted Wait
41
Actual Waits Were
82%
7-Day Rank
#5
30-Day Rank
#26
365-Day Rank
#150
Star Tours: The Adventures Continue
Average Posted Wait
30
7-Day Rank
#6
30-Day Rank
#29
365-Day Rank
#117
The Twilight Zone Tower of Terror
Average Posted Wait
55
7-Day Rank
#5
30-Day Rank
#27
365-Day Rank
#103
Toy Story Mania!
Average Posted Wait
32
Actual Waits Were
74%
7-Day Rank
#5
30-Day Rank
#27
365-Day Rank
#76
Slinky Dog Dash
Average Posted Wait
76
Actual Waits Were
76%
7-Day Rank
#3
30-Day Rank
#11
365-Day Rank
#28
Alien Swirling Saucers
Average Posted Wait
30
7-Day Rank
#4
30-Day Rank
#18
365-Day Rank
#58
Mickey & Minnie’s Runaway Railway
Average Posted Wait
36
Actual Waits Were
83%
7-Day Rank
#5
30-Day Rank
#27
365-Day Rank
#259
Millennium Falcon: Smugglers Run
Average Posted Wait
57
Actual Waits Were
93%
7-Day Rank
#6
30-Day Rank
#24
365-Day Rank
#119

EPCOT Wait Times

Mission: SPACE Orange had an average wait time today of 50 minutes. Its 7-day average is 54 minutes, so today ranks #5 for this week. Its 30-day average is 48 minutes, so today ranks #12 for the past month. Its 365-day average is 29 minutes, so today ranks #25 for the past year.

EPCOT wait times for Monday, April 5, 2021
Gran Fiesta Tour Starring The Three Caballeros
Average Posted Wait
6
Actual Waits Were
264%
7-Day Rank
#4
30-Day Rank
#16
365-Day Rank
#177
Journey Into Imagination With Figment
Average Posted Wait
15
7-Day Rank
#6
30-Day Rank
#24
365-Day Rank
#100
Living with the Land
Average Posted Wait
15
Actual Waits Were
67%
7-Day Rank
#1
30-Day Rank
#2
365-Day Rank
#41
Mission: SPACE Orange
Average Posted Wait
50
7-Day Rank
#5
30-Day Rank
#12
365-Day Rank
#25
Soarin’
Average Posted Wait
67
Actual Waits Were
61%
7-Day Rank
#2
30-Day Rank
#7
365-Day Rank
#14
Spaceship Earth
Average Posted Wait
33
Actual Waits Were
63%
7-Day Rank
#3
30-Day Rank
#5
365-Day Rank
#14
Test Track
Average Posted Wait
69
Actual Waits Were
72%
7-Day Rank
#5
30-Day Rank
#16
365-Day Rank
#55
The Seas with Nemo & Friends
Average Posted Wait
19
Actual Waits Were
38%
7-Day Rank
#3
30-Day Rank
#7
365-Day Rank
#21
Mission: SPACE Green
Average Posted Wait
15
7-Day Rank
#1
30-Day Rank
#10
365-Day Rank
#77
Frozen Ever After
Average Posted Wait
60
Actual Waits Were
63%
7-Day Rank
#1
30-Day Rank
#2
365-Day Rank
#67

The post Crowds Flock to MK, EPCOT | Disney World Wait Times for Monday, April 5, 2021 appeared first on TouringPlans.com Blog.