Disney World Wait Times for Thursday, April 22, 2021

Wait times were moderate again today across all four Walt Disney World theme parks.  As compared to the past 30 days, Hollywood Studios was the busiest park today, with average wait times ranking 10th-highest over the past month.  And although today is Earth Day and the park’s birthday, Animal Kingdom’s average posted waits were 8th-lowest of the past month today.

We counted 483 of 500 guests (97%) today at Hollywood Studios wearing masks according to Disney’s current guidelines.  And we’ve got 252 actual wait times so far today from our fabulous Lines community.  Let’s do the rest of the numbers!

Magic Kingdom Wait Times

Buzz Lightyear’s Space Ranger Spin had an average wait time today of 29 minutes. Its 7-day average is 28 minutes, so today ranks #2 for this week. Its 30-day average is 37 minutes, so today ranks #25 for the past month. Its 365-day average is 30 minutes, so today ranks #165 for the past year. We received 10 actual wait times today, and the actual wait averaged 51% of the posted wait time.

Magic Kingdom wait times for Thursday, April 22, 2021
Astro Orbiter
Average Posted Wait
37
7-Day Rank
#2
30-Day Rank
#13
365-Day Rank
#98
Big Thunder Mountain Railroad
Average Posted Wait
34
Actual Waits Were
40%
7-Day Rank
#2
30-Day Rank
#21
365-Day Rank
#213
Buzz Lightyear’s Space Ranger Spin
Average Posted Wait
29
Actual Waits Were
51%
7-Day Rank
#2
30-Day Rank
#25
365-Day Rank
#165
Prince Charming Regal Carrousel
Average Posted Wait
35
7-Day Rank
#1
30-Day Rank
#1
365-Day Rank
#1
Country Bear Jamboree
Average Posted Wait
22
7-Day Rank
#1
30-Day Rank
#1
365-Day Rank
#1
Dumbo the Flying Elephant
Average Posted Wait
20
7-Day Rank
#3
30-Day Rank
#18
365-Day Rank
#70
“it’s a small world”
Average Posted Wait
29
Actual Waits Were
62%
7-Day Rank
#5
30-Day Rank
#27
365-Day Rank
#208
Jungle Cruise
Average Posted Wait
43
Actual Waits Were
84%
7-Day Rank
#3
30-Day Rank
#22
365-Day Rank
#122
Mad Tea Party
Average Posted Wait
20
7-Day Rank
#1
30-Day Rank
#5
365-Day Rank
#36
Mickey’s PhilharMagic
Average Posted Wait
29
7-Day Rank
#5
30-Day Rank
#25
365-Day Rank
#85
Peter Pan’s Flight
Average Posted Wait
35
Actual Waits Were
99%
7-Day Rank
#4
30-Day Rank
#23
365-Day Rank
#134
Pirates of the Caribbean
Average Posted Wait
38
Actual Waits Were
78%
7-Day Rank
#3
30-Day Rank
#23
365-Day Rank
#189
Space Mountain
Average Posted Wait
35
Actual Waits Were
79%
7-Day Rank
#6
30-Day Rank
#28
365-Day Rank
#162
Splash Mountain
Average Posted Wait
67
Actual Waits Were
88%
7-Day Rank
#2
30-Day Rank
#23
365-Day Rank
#79
The Barnstormer
Average Posted Wait
16
7-Day Rank
#1
30-Day Rank
#19
365-Day Rank
#170
The Haunted Mansion
Average Posted Wait
25
Actual Waits Were
47%
7-Day Rank
#4
30-Day Rank
#18
365-Day Rank
#165
The Magic Carpets of Aladdin
Average Posted Wait
22
7-Day Rank
#1
30-Day Rank
#4
365-Day Rank
#13
The Many Adventures of Winnie the Pooh
Average Posted Wait
29
Actual Waits Were
80%
7-Day Rank
#3
30-Day Rank
#11
365-Day Rank
#78
Tomorrowland Speedway
Average Posted Wait
25
7-Day Rank
#2
30-Day Rank
#7
365-Day Rank
#31
Seven Dwarfs Mine Train
Average Posted Wait
57
7-Day Rank
#1
30-Day Rank
#15
365-Day Rank
#141
Under the Sea ~ Journey of the Little Mermaid
Average Posted Wait
20
7-Day Rank
#5
30-Day Rank
#21
365-Day Rank
#160

Animal Kingdom Wait Times

Avatar Flight of Passage had an average wait time today of 59 minutes. Its 7-day average is 56 minutes, so today ranks #2 for this week. Its 30-day average is 69 minutes, so today ranks #23 for the past month. Its 365-day average is 49 minutes, so today ranks #112 for the past year. We received 11 actual wait times today, and the actual wait averaged 81% of the posted wait time.

Animal Kingdom wait times for Thursday, April 22, 2021
DINOSAUR
Average Posted Wait
46
Actual Waits Were
90%
7-Day Rank
#2
30-Day Rank
#16
365-Day Rank
#80
Expedition Everest – Legend of the Forbidden Mountain
Average Posted Wait
19
Actual Waits Were
64%
7-Day Rank
#6
30-Day Rank
#27
365-Day Rank
#192
Kali River Rapids
Average Posted Wait
21
7-Day Rank
#3
30-Day Rank
#15
365-Day Rank
#66
Kilimanjaro Safaris
Average Posted Wait
44
Actual Waits Were
76%
7-Day Rank
#3
30-Day Rank
#8
365-Day Rank
#16
It’s Tough to Be a Bug!
Average Posted Wait
34
7-Day Rank
#1
30-Day Rank
#1
365-Day Rank
#5
TriceraTop Spin
Average Posted Wait
10
7-Day Rank
#1
30-Day Rank
#12
365-Day Rank
#39
Na’vi River Journey
Average Posted Wait
38
Actual Waits Were
67%
7-Day Rank
#2
30-Day Rank
#19
365-Day Rank
#188
Avatar Flight of Passage
Average Posted Wait
59
Actual Waits Were
81%
7-Day Rank
#2
30-Day Rank
#23
365-Day Rank
#112

Hollywood Studios Wait Times

Mickey & Minnie’s Runaway Railway had an average wait time today of 44 minutes. Its 7-day average is 41 minutes, so today ranks #1 for this week. Its 30-day average is 39 minutes, so today ranks #1 for the past month. Its 365-day average is 55 minutes, so today ranks #190 for the past year. We received 9 actual wait times today, and the actual wait averaged 75% of the posted wait time.

Hollywood Studios wait times for Thursday, April 22, 2021

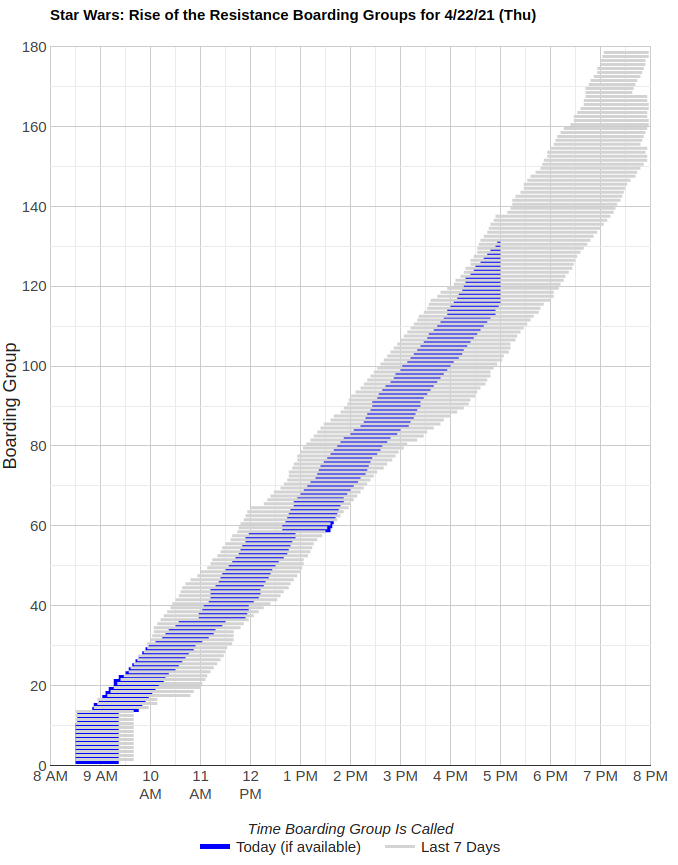
Rise of the Resistance is having another moderately successful day of operations.  Rise started calling boarding groups at 8:30 a.m. today.  There’ve been two delays in calling additional boarding groups: one around 10:30 a.m. at boarding group 36, for around 25 minutes; and another at boarding group 58 at noon, for around 40 minutes.  At its current pace, Rise of the Resistance should still be able to get to boarding group 160 day.
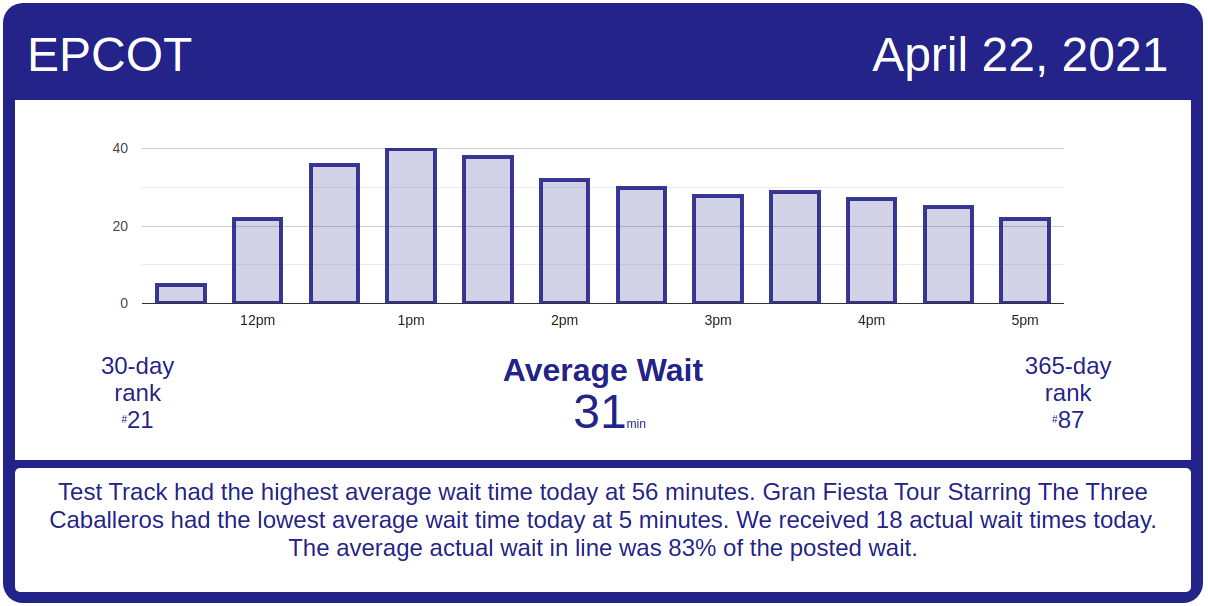
Rise of the Resistance boarding groups for Thursday, April 22, 2021
Muppet*Vision 3D
Average Posted Wait
38
7-Day Rank
#1
30-Day Rank
#1
365-Day Rank
#3
Rock ‘n’ Roller Coaster Starring Aerosmith
Average Posted Wait
40
Actual Waits Were
56%
7-Day Rank
#3
30-Day Rank
#20
365-Day Rank
#165
Star Tours: The Adventures Continue
Average Posted Wait
31
7-Day Rank
#3
30-Day Rank
#20
365-Day Rank
#110
The Twilight Zone Tower of Terror
Average Posted Wait
86
Actual Waits Were
73%
7-Day Rank
#1
30-Day Rank
#3
365-Day Rank
#7
Toy Story Mania!
Average Posted Wait
32
Actual Waits Were
59%
7-Day Rank
#1
30-Day Rank
#12
365-Day Rank
#78
Slinky Dog Dash
Average Posted Wait
76
Actual Waits Were
77%
7-Day Rank
#1
30-Day Rank
#8
365-Day Rank
#27
Alien Swirling Saucers
Average Posted Wait
35
Actual Waits Were
64%
7-Day Rank
#1
30-Day Rank
#1
365-Day Rank
#9
Mickey & Minnie’s Runaway Railway
Average Posted Wait
44
Actual Waits Were
75%
7-Day Rank
#1
30-Day Rank
#1
365-Day Rank
#190
Millennium Falcon: Smugglers Run
Average Posted Wait
53
7-Day Rank
#1
30-Day Rank
#17
365-Day Rank
#149

EPCOT Wait Times

Spaceship Earth had an average wait time today of 33 minutes. Its 7-day average is 31 minutes, so today ranks #1 for this week. Its 30-day average is 31 minutes, so today ranks #10 for the past month. Its 365-day average is 19 minutes, so today ranks #20 for the past year.

EPCOT wait times for Thursday, April 22, 2021
Gran Fiesta Tour Starring The Three Caballeros
Average Posted Wait
5
7-Day Rank
#6
30-Day Rank
#27
365-Day Rank
#269
Journey Into Imagination With Figment
Average Posted Wait
18
7-Day Rank
#3
30-Day Rank
#18
365-Day Rank
#80
Living with the Land
Average Posted Wait
16
7-Day Rank
#1
30-Day Rank
#2
365-Day Rank
#25
Mission: SPACE Orange
Average Posted Wait
39
7-Day Rank
#6
30-Day Rank
#27
365-Day Rank
#78
Soarin’
Average Posted Wait
50
7-Day Rank
#3
30-Day Rank
#26
365-Day Rank
#82
Spaceship Earth
Average Posted Wait
33
7-Day Rank
#1
30-Day Rank
#10
365-Day Rank
#20
Test Track
Average Posted Wait
56
7-Day Rank
#3
30-Day Rank
#19
365-Day Rank
#124
The Seas with Nemo & Friends
Average Posted Wait
18
7-Day Rank
#2
30-Day Rank
#16
365-Day Rank
#35
Frozen Ever After
Average Posted Wait
53
7-Day Rank
#1
30-Day Rank
#9
365-Day Rank
#92

The post Disney World Wait Times for Thursday, April 22, 2021 appeared first on TouringPlans.com Blog.